staple Be sure to indicate your lab section on your paper.
advertisement
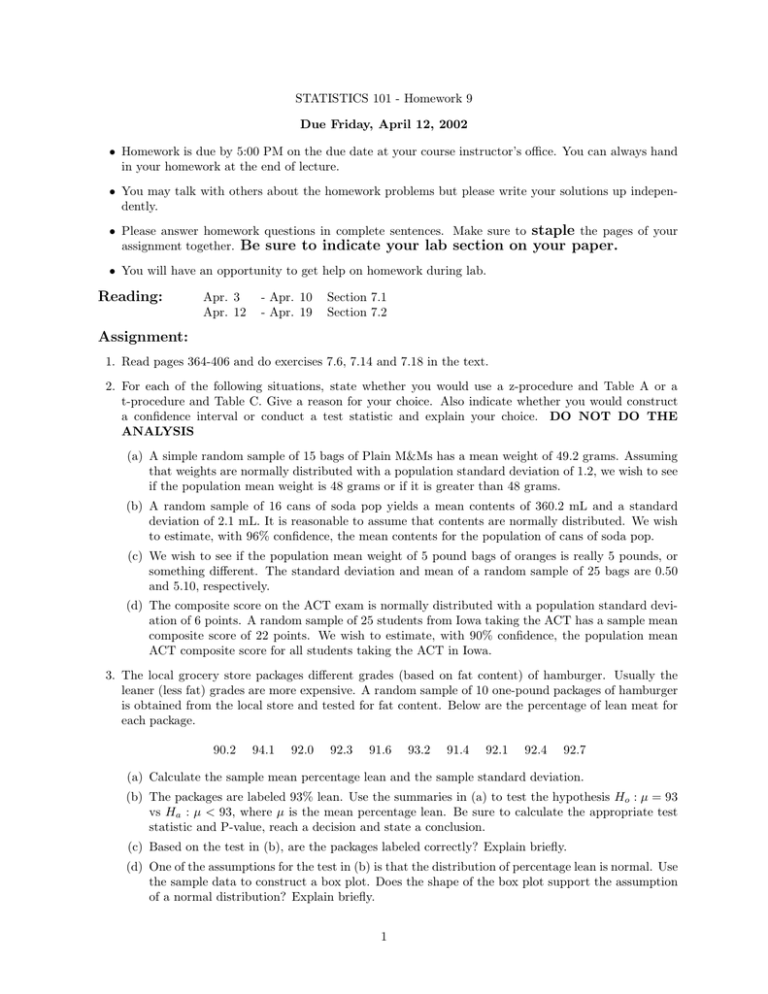
STATISTICS 101 - Homework 9 Due Friday, April 12, 2002 • Homework is due by 5:00 PM on the due date at your course instructor’s office. You can always hand in your homework at the end of lecture. • You may talk with others about the homework problems but please write your solutions up independently. • Please answer homework questions in complete sentences. Make sure to assignment together. Be sure to indicate your lab section on staple the pages of your your paper. • You will have an opportunity to get help on homework during lab. Reading: Apr. 3 Apr. 12 - Apr. 10 - Apr. 19 Section 7.1 Section 7.2 Assignment: 1. Read pages 364-406 and do exercises 7.6, 7.14 and 7.18 in the text. 2. For each of the following situations, state whether you would use a z-procedure and Table A or a t-procedure and Table C. Give a reason for your choice. Also indicate whether you would construct a confidence interval or conduct a test statistic and explain your choice. DO NOT DO THE ANALYSIS (a) A simple random sample of 15 bags of Plain M&Ms has a mean weight of 49.2 grams. Assuming that weights are normally distributed with a population standard deviation of 1.2, we wish to see if the population mean weight is 48 grams or if it is greater than 48 grams. (b) A random sample of 16 cans of soda pop yields a mean contents of 360.2 mL and a standard deviation of 2.1 mL. It is reasonable to assume that contents are normally distributed. We wish to estimate, with 96% confidence, the mean contents for the population of cans of soda pop. (c) We wish to see if the population mean weight of 5 pound bags of oranges is really 5 pounds, or something different. The standard deviation and mean of a random sample of 25 bags are 0.50 and 5.10, respectively. (d) The composite score on the ACT exam is normally distributed with a population standard deviation of 6 points. A random sample of 25 students from Iowa taking the ACT has a sample mean composite score of 22 points. We wish to estimate, with 90% confidence, the population mean ACT composite score for all students taking the ACT in Iowa. 3. The local grocery store packages different grades (based on fat content) of hamburger. Usually the leaner (less fat) grades are more expensive. A random sample of 10 one-pound packages of hamburger is obtained from the local store and tested for fat content. Below are the percentage of lean meat for each package. 90.2 94.1 92.0 92.3 91.6 93.2 91.4 92.1 92.4 92.7 (a) Calculate the sample mean percentage lean and the sample standard deviation. (b) The packages are labeled 93% lean. Use the summaries in (a) to test the hypothesis Ho : µ = 93 vs Ha : µ < 93, where µ is the mean percentage lean. Be sure to calculate the appropriate test statistic and P-value, reach a decision and state a conclusion. (c) Based on the test in (b), are the packages labeled correctly? Explain briefly. (d) One of the assumptions for the test in (b) is that the distribution of percentage lean is normal. Use the sample data to construct a box plot. Does the shape of the box plot support the assumption of a normal distribution? Explain briefly. 1 4. A department store randomly selects 100 sales receipts and calculates a sample mean amount (X=$31.68) and a sample standard deviation (s=$17.42). Based on this random sample, the store’s manager wishes to make inferences about the population mean sale amount. (a) Construct a 90% confidence interval for the population mean sale amount. (b) Originally, the store manager thought that customers spend, on average, $40. Does the confidence interval support this thought? Explain briefly. (c) There is a good possibility that the distribution of sales is skewed to the right. Explain briefly why this might be the case. (d) If the distribution of sales were skewed to the right, should we be concerned with the way the interval was constructed in (a)? Explain briefly. 2
