Background A Profile of Patient Care and Safety in Hospitals with Differing
advertisement

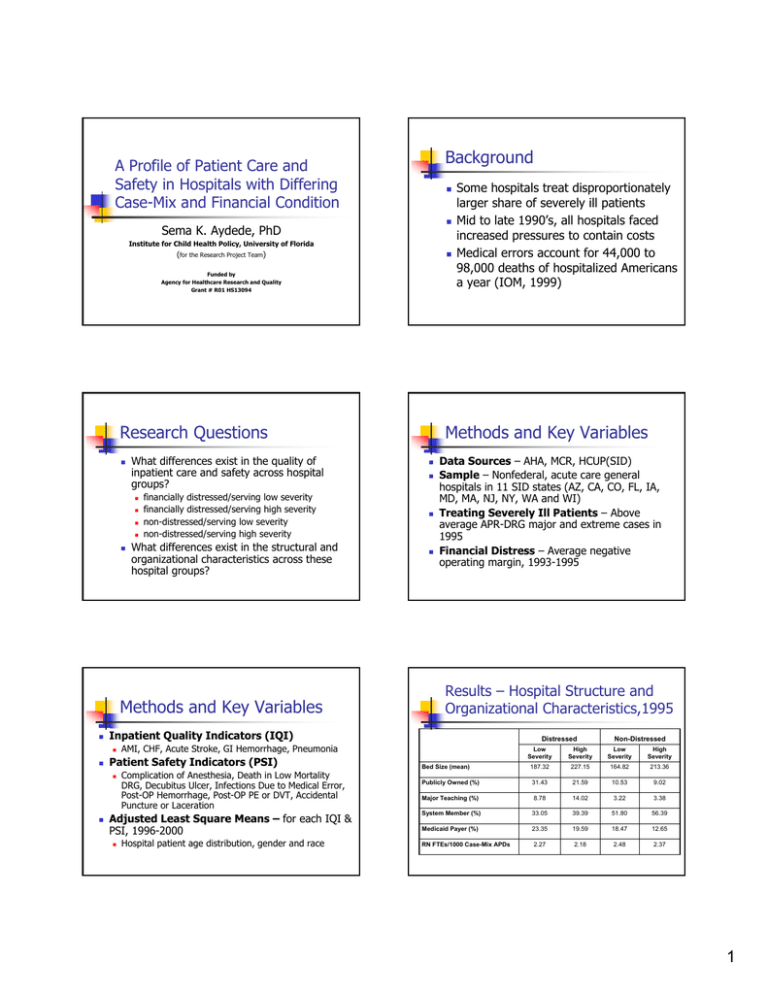
Background A Profile of Patient Care and Safety in Hospitals with Differing Case-Mix and Financial Condition Sema K. Aydede, PhD Institute for Child Health Policy, University of Florida (for the Research Project Team) Funded by Agency for Healthcare Research and Quality Grant # R01 HS13094 Research Questions What differences exist in the quality of inpatient care and safety across hospital groups? financially distressed/serving low severity financially distressed/serving high severity non-distressed/serving low severity non-distressed/serving high severity What differences exist in the structural and organizational characteristics across these hospital groups? Methods and Key Variables Data Sources – AHA, MCR, HCUP(SID) Sample – Nonfederal, acute care general hospitals in 11 SID states (AZ, CA, CO, FL, IA, MD, MA, NJ, NY, WA and WI) Treating Severely Ill Patients – Above average APR-DRG major and extreme cases in 1995 Financial Distress – Average negative operating margin, 1993-1995 Results – Hospital Structure and Organizational Characteristics,1995 Complication of Anesthesia, Death in Low Mortality DRG, Decubitus Ulcer, Infections Due to Medical Error, Post-OP Hemorrhage, Post-OP PE or DVT, Accidental Puncture or Laceration Adjusted Least Square Means – for each IQI & PSI, 1996-2000 Distressed AMI, CHF, Acute Stroke, GI Hemorrhage, Pneumonia Patient Safety Indicators (PSI) Methods and Key Variables Inpatient Quality Indicators (IQI) Some hospitals treat disproportionately larger share of severely ill patients Mid to late 1990’s, all hospitals faced increased pressures to contain costs Medical errors account for 44,000 to 98,000 deaths of hospitalized Americans a year (IOM, 1999) Hospital patient age distribution, gender and race Non-Distressed Low Severity High Severity Low Severity High Severity Bed Size (mean) 187.32 227.15 164.82 213.36 Publicly Owned (%) 31.43 21.59 10.53 9.02 Major Teaching (%) 8.78 14.02 3.22 3.38 System Member (%) 33.05 39.39 51.80 56.39 Medicaid Payer (%) 23.35 19.59 18.47 12.65 RN FTEs/1000 Case-Mix APDs 2.27 2.18 2.48 2.37 1 Results–CHF Mortality Rate Results–Stroke Mortality Rate IQI 16 IQI 17 0.07 0.16 0.06 0.14 0.05 0.12 0.04 Rates Rates 0.1 0.03 0.08 0.06 0.02 0.04 0.01 0.02 0 0 1996 1997 1998 1999 1996 2000 1997 1998 Dis tres sed/High-Severity 1999 2000 Years Ye ars Dis tress ed/Low-Severity Non-Dis tress ed/Low-Severity Distressed/Low-Severity Non-Dis tres s ed/High-Severity Distressed/High-Severity Non-Distressed/Low-Severity Non-Distressed/High-Severity Results–Pneumonia Mortality Rate Results–GI Hemorrhage Mortality Rate IQI 18 IQI 20 0.12 0.045 0.04 0.1 0.035 0.08 0.03 Rate Rate 0.025 0.02 0.06 0.015 0.04 0.01 0.02 0.005 0 1996 1997 1998 1999 2000 0 Ye ars Distressed/Low-Severity Distressed/High-Severity 1996 Non-Distressed/Low-Severity 1997 1998 1999 2000 Years Non-Distressed/High-Severity Distressed/Low-Severity Results – Decubitus Ulcer Distressed/High-Severity Non-Distressed/Low-Severity Non-Distressed/High-Severity Results – Infection Due to Medical Error PSI 03 PSI 07 0.025 0.025 0.02 0.02 0.015 Rates Rates 0.015 0.01 0.01 0.005 0.005 0 1996 1997 0 1996 1997 1998 1999 Years Dis tress ed/Low-Severity Distres sed/High-Severity Non-Distressed/Low-Severity 1998 1999 2000 Years 2000 Distressed/Low -Severity Distressed/High-Severity Non-Distressed/Low -Severity Non-Distressed/High-Severity Non-Distressed/High-Severity 2 Results–Post-Operative PE or DVT Results PSI 12 0.01 No significant differences across hospital groups 0.009 0.008 0.007 Rates 0.006 0.005 0.004 No clear pattern across hospital groups 0.003 0.002 0.001 0 1996 1997 1998 1999 IQI – AMI PSI – Sentinel event indicators (Complications of Anesthesia and Death in Low Mortality DRG) 2000 PSI – Technical complication indicators (Post-OP Hemorrhage or Hematoma and Accidental Puncture or Laceration) Ye ars Dist r essed/ Low- Sever it y Di st r essed/ Hi gh- Sever i t y Non- Di st r essed/ Low- Sever i t y Non- Di st r essed/ Hi gh- Sever i t y Significance to Policy and Future Research Summary IQI mortality rates – CHF, Stroke, GI Hemorrhage & Pneumonia Non-distressed/high severity hospitals perform better PSI adverse event rates – Decubitus Ulcer, Infections Due to Medical Error & Post-OP PE or DVT High severity hospitals (non-distressed & distressed) perform worse Learning by doing may overcome adverse effects of financial distress for IQI Future research – examine hospital volume Significant findings for post-operative medical and nursing related adverse event PSIs Future research – examine the effects of hospital facility and organizational characteristics; explore ways to better adjust for acuity Examine rates of change in IQI & PSI over time 3


