STAT 495, Fall 2010 Homework Assignment #2
advertisement
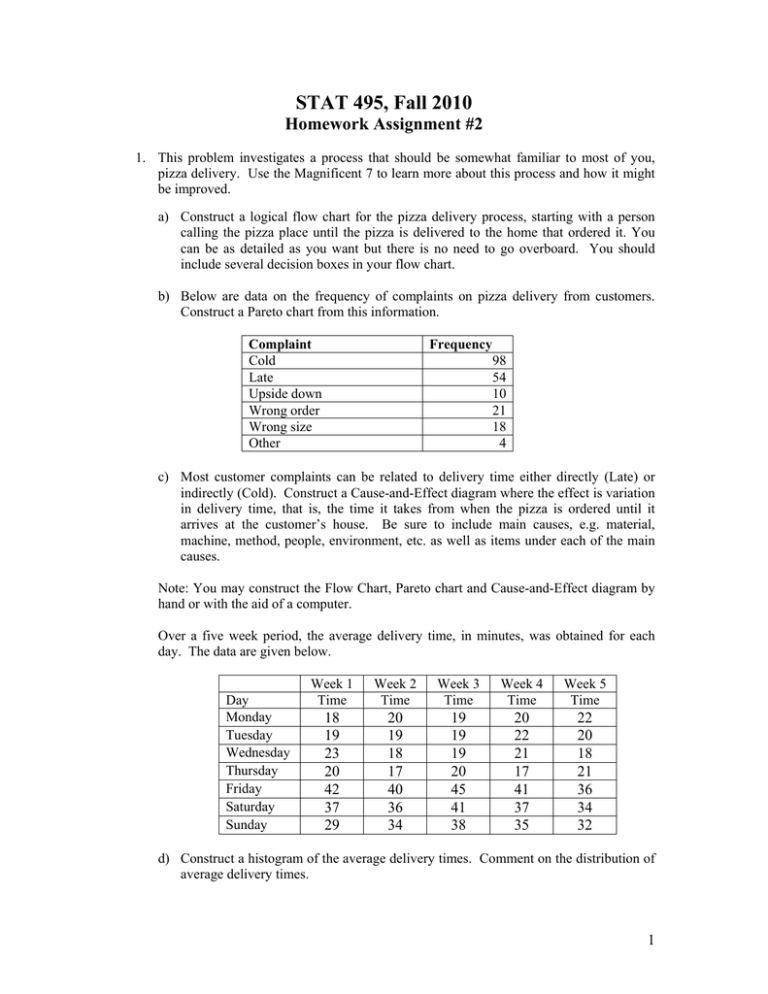
STAT 495, Fall 2010 Homework Assignment #2 1. This problem investigates a process that should be somewhat familiar to most of you, pizza delivery. Use the Magnificent 7 to learn more about this process and how it might be improved. a) Construct a logical flow chart for the pizza delivery process, starting with a person calling the pizza place until the pizza is delivered to the home that ordered it. You can be as detailed as you want but there is no need to go overboard. You should include several decision boxes in your flow chart. b) Below are data on the frequency of complaints on pizza delivery from customers. Construct a Pareto chart from this information. Complaint Cold Late Upside down Wrong order Wrong size Other Frequency 98 54 10 21 18 4 c) Most customer complaints can be related to delivery time either directly (Late) or indirectly (Cold). Construct a Cause-and-Effect diagram where the effect is variation in delivery time, that is, the time it takes from when the pizza is ordered until it arrives at the customer’s house. Be sure to include main causes, e.g. material, machine, method, people, environment, etc. as well as items under each of the main causes. Note: You may construct the Flow Chart, Pareto chart and Cause-and-Effect diagram by hand or with the aid of a computer. Over a five week period, the average delivery time, in minutes, was obtained for each day. The data are given below. Day Monday Tuesday Wednesday Thursday Friday Saturday Sunday Week 1 Time Week 2 Time Week 3 Time Week 4 Time Week 5 Time 18 19 23 20 42 37 29 20 19 18 17 40 36 34 19 19 19 20 45 41 38 20 22 21 17 41 37 35 22 20 18 21 36 34 32 d) Construct a histogram of the average delivery times. Comment on the distribution of average delivery times. 1 e) Give summary values for the center and spread of the distribution of average delivery times. f) Construct a run chart of the average delivery times. Comment on the run chart. g) Use stratification to split the delivery times into two groups. Construct separate histograms, one for each group. Give summary values for the center and spread of the distribution of average delivery times for each group. Compare the two groups in terms of center and spread. h) When customers call for a pizza delivery, what should the employee answering the phone tell them if they ask how long the delivery will take? i) Below is a plot of average pizza delivery time versus average number of orders. Describe the relationship between the two variables. How might this plot help in answering a customer’s enquiry about how long the delivery will take? j) During the week (Monday through Thursday) the pizza place has 4 delivery drivers (delivery drivers help out in the kitchen when they are not out driving) and an average 48.8 orders a day. On weekends (Friday through Sunday) there are 5 delivery drivers and an average of 83.4 orders per day. Given the data on delivery times and orders, what recommendation would you make for improving the delivery times on weekends? Be sure to support your recommendation by referring to the data. 2. Come up with an example of a flow chart, Pareto chart or Cause-and-Effect diagram from work or personal experience. Make sure that the chart is not proprietary. If you can’t find one from work or your personal experience, look in books or on the internet for an example of one of the charts. In this latter case, be sure to include a full reference to where you found the chart. 2

