Problem-9 (105 Points + 10 Points Extra Credit)
advertisement

Problem-9 (105 Points + 10 Points Extra Credit)
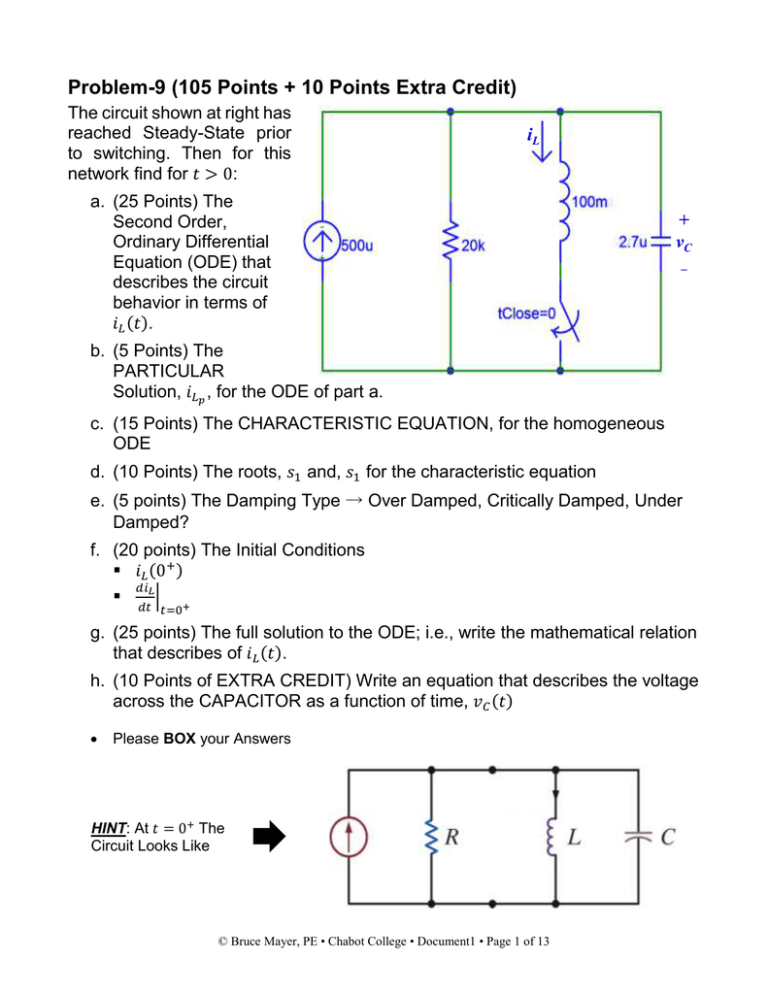
The circuit shown at right has
reached Steady-State prior
to switching. Then for this
network find for 𝑡 > 0:
iL
a. (25 Points) The
Second Order,
Ordinary Differential
Equation (ODE) that
describes the circuit
behavior in terms of
𝑖𝐿 (𝑡).
+
vC
−
b. (5 Points) The
PARTICULAR
Solution, 𝑖𝐿𝑝 , for the ODE of part a.
c. (15 Points) The CHARACTERISTIC EQUATION, for the homogeneous
ODE
d. (10 Points) The roots, 𝑠1 and, 𝑠1 for the characteristic equation
e. (5 points) The Damping Type → Over Damped, Critically Damped, Under
Damped?
f. (20 points) The Initial Conditions
𝑖𝐿 (0+ )
𝑑𝑖𝐿
| +
𝑑𝑡 𝑡=0
g. (25 points) The full solution to the ODE; i.e., write the mathematical relation
that describes of 𝑖𝐿 (𝑡).
h. (10 Points of EXTRA CREDIT) Write an equation that describes the voltage
across the CAPACITOR as a function of time, 𝑣𝐶 (𝑡)
Please BOX your Answers
HINT: At 𝑡 = 0+ The
Circuit Looks Like
© Bruce Mayer, PE • Chabot College • Document1 • Page 1 of 13
© Bruce Mayer, PE • Chabot College • Document1 • Page 2 of 13
© Bruce Mayer, PE • Chabot College • Document1 • Page 3 of 13
© Bruce Mayer, PE • Chabot College • Document1 • Page 4 of 13
© Bruce Mayer, PE • Chabot College • Document1 • Page 5 of 13
© Bruce Mayer, PE • Chabot College • Document1 • Page 6 of 13
© Bruce Mayer, PE • Chabot College • Document1 • Page 7 of 13
Print Date/Time = 29-May-16/03:59
© Bruce Mayer, PE • Chabot College • Document1 • Page 8 of 13
© Bruce Mayer, PE • Chabot College • Document1 • Page 9 of 13
Print Date/Time = 29-May-16/03:59
© Bruce Mayer, PE • Chabot College • Document1 • Page 10 of 13
Print Date/Time = 29-May-16/03:59
© Bruce Mayer, PE • Chabot College • Document1 • Page 11 of 13
Print Date/Time = 29-May-16/03:59
© Bruce Mayer, PE • Chabot College • Document1 • Page 12 of 13
SOLUTION: Check by MuPAD
R := 20e3; L := 100e-3; C:= 2.7e-6; Is := 500e-6;
iLode := ode({L*C*iL''(t) + (L/R)*iL'(t) + iL(t) = Is, iL'(0) = 100,
iL(0) = 0}, iL(t))
iLsoln := solve(iLode)
iLsoln_mA := 1000*iLsoln
plot(iLsoln_mA, t =0..0.3, GridVisible = TRUE,
LineWidth = 0.03*unit::inch,
Width = 320*unit::mm, Height = 180*unit::mm,
AxesTitleFont = ["sans-serif", 24],
TicksLabelFont=["sans-serif", 16])
Print Date/Time = 29-May-16/03:59
© Bruce Mayer, PE • Chabot College • Document1 • Page 13 of 13


