WESTERN EUROPE 1939-1945: HAMBURG
advertisement
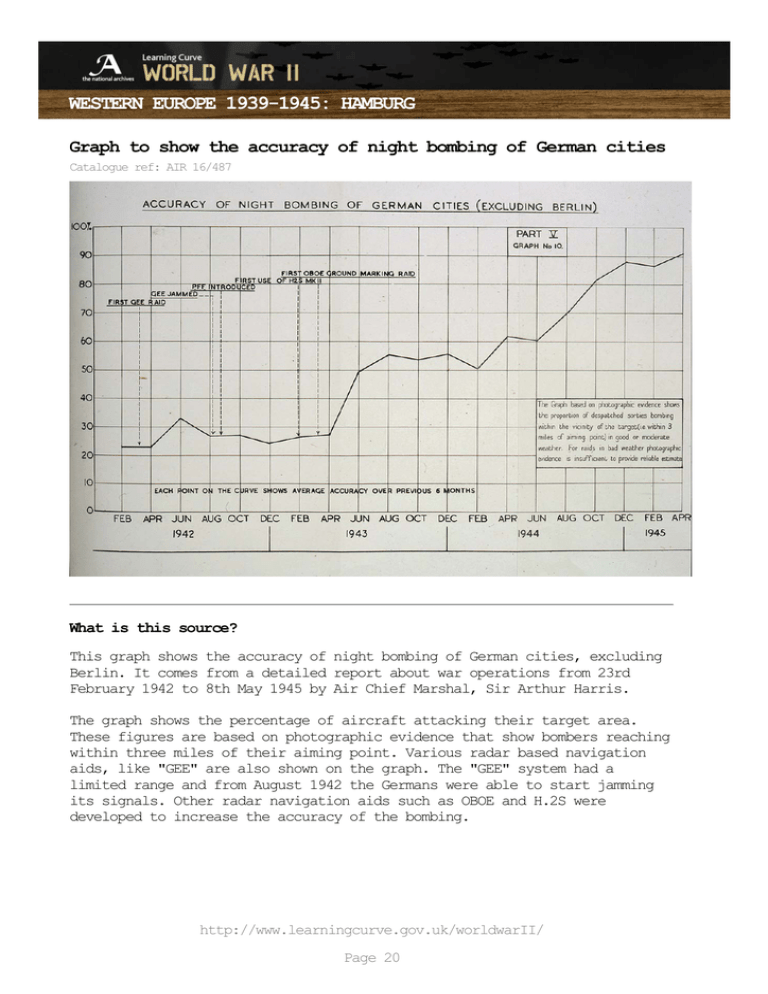
WESTERN EUROPE 1939-1945: HAMBURG Graph to show the accuracy of night bombing of German cities Catalogue ref: AIR 16/487 What is this source? This graph shows the accuracy of night bombing of German cities, excluding Berlin. It comes from a detailed report about war operations from 23rd February 1942 to 8th May 1945 by Air Chief Marshal, Sir Arthur Harris. The graph shows the percentage of aircraft attacking their target area. These figures are based on photographic evidence that show bombers reaching within three miles of their aiming point. Various radar based navigation aids, like "GEE" are also shown on the graph. The "GEE" system had a limited range and from August 1942 the Germans were able to start jamming its signals. Other radar navigation aids such as OBOE and H.2S were developed to increase the accuracy of the bombing. http://www.learningcurve.gov.uk/worldwarII/ Page 20 WESTERN EUROPE 1939-1945: HAMBURG What’s the background to this source? The war began in 1939 and went well for Germany at first. By 1940 Hitler controlled most of Western Europe, apart from Britain. He then attacked the USSR in the summer of 1941. This became the main campaign of the war. However, Britain was anxious to try and help her Soviet allies. Britain did not have the resources to attack Germany on the ground but they did have a fleet of heavy bombers that could attack Germany by air. The content Sir Arthur Harris's report covers the course of war in terms of bombing technique, tactics and types of bomb. The report also includes a summary of the bombing effort and its results. It’s worth knowing that... An earlier report in 1941 showed that most bombs did not fall within five miles of their target. Also, daylight raids on well defended targets led to huge losses of aircraft and aircrew. As a result, the RAF Bomber Command chief Sir Arthur Harris decided to use area bombing. Basically, this meant destroying the whole city so that the industrial targets would be destroyed and so would civilian housing. How does this source help us to understand why the RAF bombed German cities? 1. According to this graph in what month/year does accuracy of night bombing seem to increase? 2. How can you explain this according to the graph? 3. Can this source be used to support any of the viewpoints A-D for your debate? http://www.learningcurve.gov.uk/worldwarII/ Page 21
