T Estimating the Cost and Potential of Reducing Emissions from Deforestation
advertisement
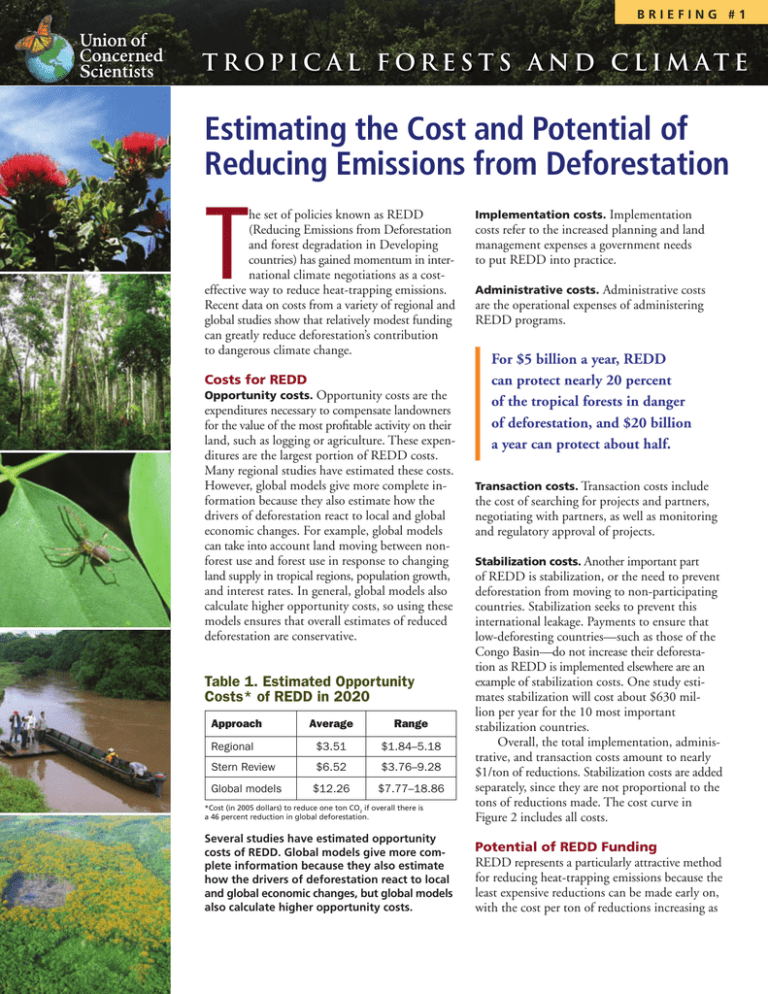
Briefing #1 T r o p i c a l F o r e s t s a n d C l i m at e Estimating the Cost and Potential of Reducing Emissions from Deforestation T he set of policies known as REDD (Reducing Emissions from Deforestation and forest degradation in Developing countries) has gained momentum in international climate negotiations as a costeffective way to reduce heat-trapping emissions. Recent data on costs from a variety of regional and global studies show that relatively modest funding can greatly reduce deforestation’s contribution to dangerous climate change. Costs for REDD Opportunity costs. Opportunity costs are the expenditures necessary to compensate landowners for the value of the most profitable activity on their land, such as logging or agriculture. These expenditures are the largest portion of REDD costs. Many regional studies have estimated these costs. However, global models give more complete information because they also estimate how the drivers of deforestation react to local and global economic changes. For example, global models can take into account land moving between nonforest use and forest use in response to changing land supply in tropical regions, population growth, and interest rates. In general, global models also calculate higher opportunity costs, so using these models ensures that overall estimates of reduced deforestation are conservative. Implementation costs. Implementation costs refer to the increased planning and land management expenses a government needs to put REDD into practice. Administrative costs. Administrative costs are the operational expenses of administering REDD programs. For $5 billion a year, REDD can protect nearly 20 percent of the tropical forests in danger of deforestation, and $20 billion a year can protect about half. Transaction costs. Transaction costs include the cost of searching for projects and partners, negotiating with partners, as well as monitoring and regulatory approval of projects. Stabilization costs. Another important part *Cost (in 2005 dollars) to reduce one ton CO2 if overall there is a 46 percent reduction in global deforestation. of REDD is stabilization, or the need to prevent deforestation from moving to non-participating countries. Stabilization seeks to prevent this international leakage. Payments to ensure that low-deforesting countries—such as those of the Congo Basin—do not increase their deforestation as REDD is implemented elsewhere are an example of stabilization costs. One study estimates stabilization will cost about $630 million per year for the 10 most important stabilization countries. Overall, the total implementation, administrative, and transaction costs amount to nearly $1/ton of reductions. Stabilization costs are added separately, since they are not proportional to the tons of reductions made. The cost curve in Figure 2 includes all costs. Several studies have estimated opportunity costs of REDD. Global models give more complete information because they also estimate how the drivers of deforestation react to local and global economic changes, but global models also calculate higher opportunity costs. Potential of REDD Funding REDD represents a particularly attractive method for reducing heat-trapping emissions because the least expensive reductions can be made early on, with the cost per ton of reductions increasing as Table 1. Estimated Opportunity Costs* of REDD in 2020 Approach Average Range Regional $3.51 $1.84–5.18 Stern Review $6.52 $3.76–9.28 Global models $12.26 $7.77–18.86 Conclusion The data show that REDD can greatly reduce tropical deforestation and heattrapping emissions with modest funding. Because estimates here use conservative methods and include all costs, estimates are higher than previous studies for Figure 1. Estimated Annual Emission Reductions from REDD Expenditure in 2020 Reduction in Emissions (million metric tons CO2) 4,000 Mean Estimate High and Low Estimate Relatively modest funding of REDD in early years can lead to significant emissions reductions in 2020. 3,000 2,000 1,000 0 0 10 20 30 40 Cost of REDD (in billions of U.S. dollars) 50 Figure 2. Reduction in Deforestation Emissions as a Function of Carbon Price for 2020 100% Reduction in Deforestation more reductions are made. The cost curve and supply curve for REDD in the year 2020 are estimated by averaging recently published results from the three main global models—DIMA, GTM and GCOMAP. For $5 billion a year, REDD can protect nearly 20 percent of the tropical forests in danger of deforestation, and $20 billion a year can protect about half. With funding approaching $50 billion a year, tropical deforestation could be reduced by two-thirds. The global models vary significantly in their overall cost estimates, but much of the variation is due to different underlying assumptions relating to the carbon stocks and baseline deforestation in different regions. For this reason, the reductions shown in Figure 1 are reductions from the different baseline levels used by each of the three models. Even the higher cost estimates demonstrate that REDD is an inexpensive means to reduce global warming. The financing for REDD could come from several different kinds of mechanisms, and the cost and supply curves shown here do not assume any specific funding source. For example, financing could come from direct carbon market offsets, market-linked auction revenues from domestic cap-and-trade programs, voluntary contributions, or a combination of these. The funding mechanism will likely transition from voluntary to market-linked to direct carbon market, with the latter providing more substantial funding in later periods. 80% Mean Estimate High and Low Estimate 60% 40% Reasonable carbon prices can lead to substantial decreases in deforestation. 20% 0% 0 10 20 comparable reductions (e.g., about $20 billion a year to cut deforestation by half, compared to the $5–15 billion 30 40 50 Carbon Price ($/tCO2) 60 70 a year estimate of the Stern Review). Nonetheless, REDD remains a very costeffective way to address global warming. Doug Boucher, Ph.D., (Director, Tropical Forest and Climate Initiative, Union of Concerned Scientists) prepared this summary with assistance from Diana Movius and Carolyn Davidson. © September 2008 Union of Concerned Scientists. Printed on recycled paper with vegetable-based inks Two Brattle Square, Cambridge, MA 02238-9105. Main Office (617) 547-5552 • Washington, DC (202) 223-6133 A fully referenced version is available at www.ucsusa.org/REDD.html. 80


