EFFICIENT IMPLEMENTATIONS OF OPERATIONS ON RUNLENGTH-REPRESENTED IMAGES Øyvind Ryan
advertisement
EFFICIENT IMPLEMENTATIONS OF OPERATIONS ON
RUNLENGTH-REPRESENTED IMAGES
Øyvind Ryan
Department of Informatics, Group for Digital Signal Processing and Image Analysis,
University of Oslo, P.O Box 1080 Blindern, NO-0316 Oslo, Norway
phone: + (47) 22 84 01 50, fax: + (47) 22 85 24 01, email: oyvindry@ifi.uio.no
web: www.ifi.uio.no/∼oyvindry
40
ABSTRACT
1. INTRODUCTION
As memory capacity in modern computer architectures continues to
increase, it is unlikely that all memory can be accessed efficiently.
Therefore, modern computer architectures have higher level caches
intended for frequently accessed data, and devices like RAM and
disk for infrequently accessed data [4]. The key to high performance applications is to have frequently accessed memory resident
in the higher level caches, and in general as few memory accesses
as possible.
This paper aims at two goals:
1. Show that processing a number of bi-level images in runlengthrepresented form is highly memory- and cache-efficient, giving
better performance than traditional raster-based processing.
2. Show that it is possible to develop memory efficient server-side
solutions for handling many concurrent image processing tasks.
Surprisingly, most well-known APIs today use a Raster (a rectangular array of pixels) as the only means of referencing image
data. Very often the entire raster is cached prior to any coding. This means that applications having many concurrent requests
would require a lot of memory. For instance the Java Image I/O
API (http://java.sun.com/j2se/1.4.2/docs/guide/imageio/) is based
on Raster access.
In this paper, terminology for comparing raster-based and
runlength-based methods will be introduced. Test images consisting of a number of bi-level layers (introduced in section 3) will be
used. These are large images which are tiled. Runlength-based
and raster-based processing are performed for each tile to generate
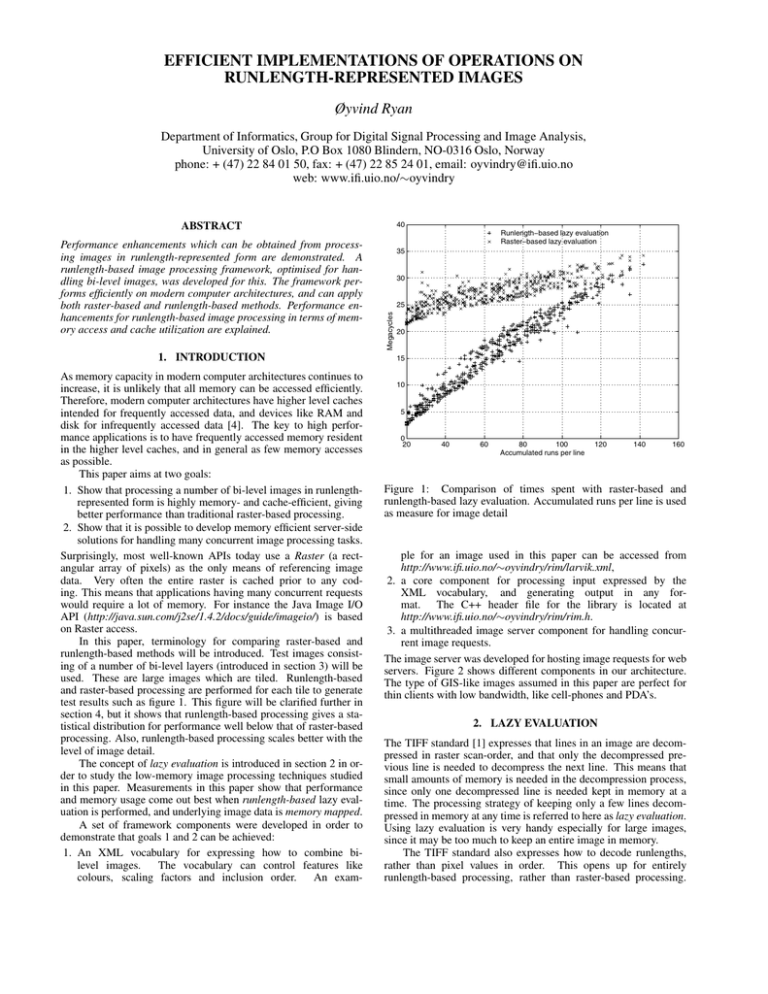
test results such as figure 1. This figure will be clarified further in
section 4, but it shows that runlength-based processing gives a statistical distribution for performance well below that of raster-based
processing. Also, runlength-based processing scales better with the
level of image detail.
The concept of lazy evaluation is introduced in section 2 in order to study the low-memory image processing techniques studied
in this paper. Measurements in this paper show that performance
and memory usage come out best when runlength-based lazy evaluation is performed, and underlying image data is memory mapped.
A set of framework components were developed in order to
demonstrate that goals 1 and 2 can be achieved:
1. An XML vocabulary for expressing how to combine bilevel images.
The vocabulary can control features like
colours, scaling factors and inclusion order.
An exam-
Runlength−based lazy evaluation
Raster−based lazy evaluation
35
30
25
Megacycles
Performance enhancements which can be obtained from processing images in runlength-represented form are demonstrated. A
runlength-based image processing framework, optimised for handling bi-level images, was developed for this. The framework performs efficiently on modern computer architectures, and can apply
both raster-based and runlength-based methods. Performance enhancements for runlength-based image processing in terms of memory access and cache utilization are explained.
20
15
10
5
0
20
40
60
80
100
Accumulated runs per line
120
140
160
Figure 1: Comparison of times spent with raster-based and
runlength-based lazy evaluation. Accumulated runs per line is used
as measure for image detail
ple for an image used in this paper can be accessed from
http://www.ifi.uio.no/∼oyvindry/rim/larvik.xml,
2. a core component for processing input expressed by the
XML vocabulary, and generating output in any format. The C++ header file for the library is located at
http://www.ifi.uio.no/∼oyvindry/rim/rim.h.
3. a multithreaded image server component for handling concurrent image requests.
The image server was developed for hosting image requests for web
servers. Figure 2 shows different components in our architecture.
The type of GIS-like images assumed in this paper are perfect for
thin clients with low bandwidth, like cell-phones and PDA’s.
2. LAZY EVALUATION
The TIFF standard [1] expresses that lines in an image are decompressed in raster scan-order, and that only the decompressed previous line is needed to decompress the next line. This means that
small amounts of memory is needed in the decompression process,
since only one decompressed line is needed kept in memory at a
time. The processing strategy of keeping only a few lines decompressed in memory at any time is referred to here as lazy evaluation.
Using lazy evaluation is very handy especially for large images,
since it may be too much to keep an entire image in memory.
The TIFF standard also expresses how to decode runlengths,
rather than pixel values in order. This opens up for entirely
runlength-based processing, rather than raster-based processing.
Client
HTTP
Web server
Image data
Image Server
PPP
qq
PPP
qqq
PPP
q
q
PPP
q
q
'
xqqq
/ Image library core
XML files W W XML evaluator
W W W
g
W W Wg g g g
g g W W W
g
g
W W W
sg g g
+
Vector files
Image files
Figure 2: Workflow in the Image Server architecture.
One can thus differ between raster-based lazy evaluation and
runlength-based lazy evaluation. These strategies are compared in
this paper. Comparisons with no lazy evaluation at all is also done.
The TIFF standard motivates the following runlengthrepresentation of the part of a bi-level image with upper left coordinates (x, y) and lower right coordinates (x + wdt, y + lth):
• Each line is represented as a strictly increasing sequence of
numbers. The numbers are the points where background/foreground changes occur, measured relative to the left side (x) of
the image.
• A background/foreground change at wdt is added as a terminator for the runlength representation.
To elaborate, if x = 0, wdt = 100 and the pixels between 20
and 80 is foreground with the rest being background, runlengthrepresentation of the line would be {20, 80, 100}. It is seen that
only 3 values are needed to represent 100 pixels in this case, making the runlength representation superior in cases with few foreground/background changes.
This paper is primarily interested in images comprising of a
limited number of bi-level layers. With raster-based lazy evaluation,
operations are performed on raster scanlines, and merging layers is
simply a copy operation into a raster. With runlength-based lazy
evaluation, this is different: Runlength-represented lines need to be
merged, and in this case this is not a simple copy operation. Layer
merge needs to be done by traversing many runlength-represented
lines in parallel. This presents an additional algorithm step, which
is called the layer merge algorithm. This algorithm takes an ordered
series of runlength-represented input lines, and produces a merged
runlength-represented output line. Much time is spent in this algorithm if many images are combined, so it must be subject to much
optimisation.
3. PERFORMANCE ISSUES FOR LAZY EVALUATION
The image processing library we use contains implementations of
several image standards from scratch. Implementation from scratch
had to be done in order to optimise for lazy evaluation. It would
have been nice to use image format plugins from other parties, but
this is impossible as long as most image processing libraries are
entirely raster-based. The image processing library was a big task
to develop, it contains about 80000 lines of code. C++ was used
as programming language due to high performance demands. Performing lazy evaluation on runlength-represented images produces
a string of efficiency issues. Particularly two issues will be of concern:
A runlength-representation may work well only up to a certain
level of image detail. With much detail in the image comes a very
time-consuming layer merge procedure. The term used to quantify image detail in this paper is accumulated runs per line. This
is measured by calculating the total number of runs (background
AND foreground) for all layers, adding them, and finally taking a
Figure 3: Layered image of Larvik, one of the test images used in
this paper
line average. It is not taken into account that runs from one layer
shadow for runs in other layers. Consequently, accumulated runs is
not the same as the actual number of runs in the layered image, it is
somewhat higher. This is not a problem for our purposes, since accumulated runs per line still gives a good indication of image detail.
Intuitively, a raster-based representation would work best at high
numbers for accumulated runs per line. Map data normally have
low numbers for accumulated runs per line.
There is also a limit to how many layers which could be involved before the layer merge procedure becomes slow.
3.1 Measurements in this paper
The Intel VTune Performance Analyser on win32 systems has been
used in the process of hunting down performance bottlenecks for
software used in this paper. Measurements have been done with
hot disk cache, i.e. the disk cache is already filled with relevant
data prior to measurements to prevent I/O from obscuring measurements. The disk cache is ”warmed up” through a previous run of the
program. Similarly, measurements performed do not include time
used to write data TO disk.
All measurements are done on a set of two test images comprising of a high number of TIFF G4 bi-level layers. They show
different parts of Norway, the first one being a Norwegian city map
shown in figure 3. This image is 8000 × 8000 pixels in size. Both
have 19 layers, and have tile dimensions of 512 × 512. In the measurements, the set of included layers is varied. Different plots for
performance for different coding strategies are shown in this paper.
The terms gigacycles (= 109 clock cycles) and megacycles (= 106
clock cycles) are used for performance measurements where applicable (gigacycles for large images requiring much from the CPU,
megacycles for smaller images). All figures in this paper measuring
performance show numbers for clock cycles for a single request.
The performance plots also have an indication for standard deviation for each measurement. The means of the measurements are
plotted, while a bar above and below them indicate the standard
deviation where applicable. In this paper, measurements were performed 20 times to achieve a ”low enough” standard deviation.
This paper limits itself to TIFF input and GIF [5] output, as
100
25
80
20
60
15
Count
Percent
15
40
10
10
5
gigacycles
20
0
Raster−based lazy evaluation
Runlength−based lazy evaluation
50
100
Accumulated runs per line
150
0
50
100
Accumulated runs per line
150
(a) Time percentage spent with the (b) Distribution of accumulated runs
layer merge algorithm
per line in the test images
5
Figure 6: Distribution of accumulated runs per line in the test images
0
0
2
4
6
8
10
12
Number of layers
14
16
18
20
Figure 4: Total transcoding times for different coding strategies
15
gigacycles
10
Total time
Decompression
Compression
5
0
0
2
4
6
8
10
12
Number of layers
14
16
18
20
Figure 5: Time used for raster-based lazy evaluation
these formats are easily demonstrated with runlength-based lazy
evaluation. The focus in the measurements is the time to transcode
the TIFF input layers to a single GIF output image. The TIFF standard ( [1], [6] chapter 6.8) has high focus on bi-level images. It is in
much use, although newer standards like JBIG2 [2] also exist. The
library we use contains support for TIFF G4 with optimizations for
lazy evaluation.
GIF can employ ways to utilize runlength-representations. During GIF compression, a hash table is consulted to maintain codes
for different combinations of pixels. Runlength-representations can
be used to reduce the number of hash table lookups by in addition
administering arrays with codes for runs of different lengths for different layers.
4. COMPARING DIFFERENT CODING STRATEGIES
Runlength-based and raster-based lazy evaluation transcoding
strategies are first compared. Figure 4 shows total transcoding times
for these strategies. Figure 5 shows details for the raster-based strategy. The compression process is here seen to take most time. The
entire test images are generated by gradually increasing the num-
ber of layers involved. Performance does not increase linearly with
number of layers, this is due to the fact that layers have varying
complexity. It is clear from the figures that runlength-based lazy
evaluation works better at all number of layers, but that the difference from raster-based lazy evaluation is smaller when more layers
are involved. It is to expect that, if the number of layers is high
enough, raster-based lazy evaluation would work better. There is
overhead with the layer merge algorithm. For the images used here,
it is seen that this overhead pays off since total transcoding time
can be decreased due to runlength optimizations. Raster-based lazy
evaluation saves time by dropping layer merge, but spends more
time by traversing an entire raster when coding.
An ideal image processing framework should switch to rasterbased lazy evaluation at some point. This is reflected in figure 1,
where the two test images are used as input, and different tiles are
traversed to get various accumulated runs per line. It is seen from
the figure that raster-based lazy evaluation performs just as well (or
even better) as runlength-based lazy evaluation at high values for
accumulated runs per line, but that runlength-based lazy evaluation
performs better at lower values for accumulated runs per line. It
is also seen that both strategies have a close-to-linear relationship
with the level of image detail. The first plot in figure 6 shows the
time percentage spent with the layer merge algorithm. Points are
scattered, this tells us that the layer merge algorithm is highly input
dependent. The second plot in figure 6 shows the distribution of
accumulated runs per line in the test images.
The overhead of decoding is small when compared to compression, as is seen from figure 5. This motivates us to work with data
in compressed form, which has become increasingly popular due to
gains which can be achieved due to fitting smaller data into caches.
Database indices are often traversed in compressed form due to little
extra decompression overhead.
5. MEMORY MAPPING
Memory mapping( [4] chapter 5.10) is used by operating systems
to administer much used resources efficiently. The point is to have
data paged only upon request, and avoid dirty pages. Surprisingly,
memory mapping is not well known everywhere. Consequently,
many programmers read data directly into RAM. With much data
accessed frequently, this leads to extensive paging and swapping.
Memory mapping is very attractive to combine with lazy evaluation: While memory mapping accounts for making data available
in RAM in a lazy manner, lazy evaluation accounts for decompressing these data in a lazy manner. When the two are combined, the
entire handling of image data will be performed upon request only.
To measure the effects of memory mapping, a working set analysis is performed when image files are read directly into RAM, and
when memory mapping is used.
The working set of information W (t, τ ) of a process at time t is
defined as the collection of information referenced by the process
during the process time interval (t − τ ,t) [3]. The working set was
introduced as a characteristic for the operating system to monitor
1400
1400
1200
1200
1000
1000
800
800
Files memory−mapped
Writable pages
Files read into memory
Writable pages
600
600
400
400
200
200
0
0
1
2
3
gigacycles
4
5
Files memory−mapped
Writable pages
Files read into memory
Writable pages
6
0
0
0.1
0.2
0.3
0.4
0.5
0.6
gigacycles
0.7
0.8
0.9
1
Figure 7: Process working set with and without memory mapping.
8000 × 8000 image
Figure 8: Process working set with and without memory mapping.
512 × 512 image
and base it’s allocation decisions on. These thoughts appeared in the
literature almost 40 years ago, and are still valid today. The working
set is still, and will continue to be an important performance metric.
Information is here in terms of pages.
The working set is measured with the Psapi library in the Visual
studio 7.0 platform SDK on Windows XP. This library gives information about all the pages in the working set, including whether
they are read-only, shared or writable.
Processing a whole image (8000 × 8000 pixels, figure 7), and
one small image (512 × 512 pixels, figure 8) is performed. The
large image serves to ensure that large amounts of data need to be
memory mapped. It is noted that these are merely tests. Remarks
listed here are not conclusive, but are mere observations related to
the measurements.
• The process working set is seen to be highest without memory
mapping. This means that performance would suffer most with
this strategy when the server experiences high loads, since the
working set influences paging behaviour.
• It is seen that the working set increases more gradually when
memory mapping is used. This is as expected, since memory
mapping gradually makes more and more data physically resident.
• One would expect that the working set would approach the same
upper limit with both strategies when a whole image is processed. As is seen, the memory mapping strategy does not reach
this high. An explanation for this can be found in the presence of
multiple subfiles in the image file. TIFF supports having multiple subfiles embedded in the same file. The technology described in this paper uses multiple subfiles to speed up certain
image processing operations. These subfiles are not processed
in the measurements, hence they are not mapped into RAM.
• The working set is seen to be smaller when the image is small
with the memory mapping strategy.
• The working set is seen to have a high initial number of pages.
A plausible explanation for this can be shared pages originating from libraries needed by the running program. In any case,
the operating system controls certain resources which may contribute to the working set.
• Pages are classified into read-only and writable pages. The
number of writable pages has also been measured explicitly.
The memory mapping strategy is superior when it comes to having few writable pages.
It is tempting to have the entire image decompressed in memory in
a server-side solution, to avoid the overhead of decompressing data.
The problem with this is that it requires a large working set. A small
working set is attractive, and reduces swapping, gives better locality
of reference, fewer page faults, and more cache hits.
In the next section the image server is used to generate high
loads. The image server component maintains memory mappings
for all images, so that as few memory mappings as needed are created.
6. IMAGE SERVER EXPERIMENTS
Here it is demonstrated that lazy evaluation is a good strategy when
processor demands get higher. No lazy evaluation means that an
entire raster is set prior to coding. Many requests drawing into different rasters would then pollute the cache with large amounts of
memory.
Figure 9 comes from a test program posting 10 concurrent image server requests for a single tile. It shows memory usage at different points in time, these being instants where memory allocations
are performed. Some observations from figure 9 are in place:
It is seen that less memory is used with lazy evaluation. These
numbers can be partially deduced from table 1, where significant
memory allocations for different strategies are gone through.
The difference spent in time between lazy evaluation and no
lazy evaluation is not as high as is indicated by figure 4. This has
to do with the fact that a tile with much detail is tested on. For such
tiles, figure 1 shows that runlength-based and raster-based methods
do not differ much.
It is reasonable to assume good cache utilization with lazy evaluation due to low memory usage. Measurements which confirm
numbers for cache misses are not dealt with in this paper. Increasing the number of concurrent image server requests would be a good
way to trigger cache misses.
7. MEMORY USAGE
Different implementation strategies use different amounts of memory. The amounts of memory used for three different strategies are
compared in this section: Runlength-based lazy evaluation with and
without memory mapping, and memory mapping without lazy evaluation. Each strategy is tested on different number of layers and
image size, the results are displayed in table 1. Significant memory
allocations are listed in the table, like runlength-represented lines
and output buffer for the image data. The listed memory allocations
dynamic memory (megabytes)
dynamic memory (megabytes)
6
5
4
3
2
1
0
4
4.5
5
gigacycles
5.5
5
9. CONCLUSION AND FUTURE WORK
4
There is still much room for smart image processing applications
when it comes to high demands for performance. The concept of
lazy evaluation is tested here on specific images with a specifically
developed library to illustrate this. Lazy evaluation has clear benefits when combined with memory mapping, leading to attractive
numbers for memory usage. It was also argued that lazy evaluation
is very attractive to cache utilization.
There are many follow-ups to the practical implementation and
applications of runlength-based lazy evaluation. Runlength-based
lazy evaluation is attractive when it comes to other operations such
as rotation and computing image differences. A paper is already
in progress to demonstrate thin client applications using the image
server framework.
Results in this paper were obtained with an Intel Pentium M
processor with 1600MHz clock speed, L2 cache size of 1MB and
512 MB RAM. All tests were run under Windows XP, and all programs were compiled with Microsoft Visual C++.NET 7.1.
3
2
1
0
4.5
5
5.5
6
gigacycles
6.5
7
(a) Memory usage, runlength-based (b) Memory usage, no lazy evalualazy evaluation
tion
Figure 9: Comparison of image server memory usage with and
without lazy evaluation
Strategies
a)
b)
c)
Image with 19 layers. Entire image is rendered
Runlength-rep. lines 659
659
659
Output buffer
75
75
75
Raster allocation
0 62500
0
Files read into RAM
0
0
3200
Image with 10 layers. One tile only is rendered
Runlength-rep. lines
41
41
41
Output buffer
8
8
8
Raster allocation
0
256
0
Files read into RAM
0
0
1728
Table 1: Memory (in kilobytes) three strategies: a) Memory mapping. b) No lazy evaluation. c) No memory mapping. Image with
10 layers, one tile rendered
stand for 80% of peak memory for lazy evaluation.
It is seen that memory increases with the size of the image, and
that lazy evaluation is superior when it comes to memory usage.
Runlength-represented lines are the major allocations for the memory mapping strategy, particularly if many layers are involved or the
image is large.
8. LAZY EVALUATION FOR OTHER OUTPUT FORMATS
Lazy evaluation does not lend itself directly to all output formats,
like it does to GIF in this paper. One image format which can be
adapted to lazy evaluation is JPEG2000 [7].
JPEG2000 groups samples in blocks, and applies arithmetic
coding to them. 4 block rows are at any point active when coding,
so that one can only hope for working with 4 decompressed lines
at a time. JPEG2000 uses an (optional) Discrete Wavelet Transform (DWT). The DWT can be applied in stages, depending on the
desired resolution level. When applying DWT, a larger cache of
transformed subband samples may be needed when coding. Many
implementations of the DWT exist which buffer up all subband samples in one DWT stage before going to the next stage (sequential
DWT). This strategy is not compatible with lazy evaluation, since
it requires many image lines decompressed in memory at the same
time. Fortunately, the DWT can also be implemented in a pipelined
manner which consumes image input lines incrementally, see [7]
chapter 17.4. With pipelining, DWT stages are performed in a lazy
manner, i.e. when enough subband samples are available. Pipelining of DWT stages is the strategy which a JPEG2000 coder should
apply to take advantage of lazy evaluation. To utilize lazy evaluation as best we can, DWT pipelining can also be paired with a fitting
progression order, [7] chapter 13.1.1.
Acknowledgement
I give my sincere thanks to Stein Jørgen Ryan for helpful discussions on different topics presented in this paper.
The work in this paper is based on the RIM library from Raster
Imaging AS (www.rasterimaging.com) which provides high performance imaging technologies using technology developed by Dr.
Sandor Seres. The post.doc project carried out by Dr. Øyvind Ryan
at the University of Oslo has enhanced this implementation, and
added algorithms for improved performance and scalability with regards to server applications and memory consumption.
This project has been sponsored by the Norwegian Research
Council, project nr. 160130/V30.
REFERENCES
[1] CCITT, Recommendation T.6. Facsimile Coding Schemes and
Coding Control Functions for Group 4 Facsimile Apparatus,
1985.
[2] ISO/IEC 14492 and ITU-T Recommendation T.88. JBIG2 bilevel image compression standard., 2000.
[3] Peter J. Denning. The working set model for program behavior.
Communications of the ACM, 11(5):323–333, 1968.
[4] John L. Hennessy and David A. Patterson. Computer Architecture. A Quantitative Approach. Third Edition. Morgan Kaufmann, 2003.
[5] M. R. Nelson. Lzw data compression. Dr. Dobb’s Journal,
pages 29–36,86–87, 1989.
[6] Khalid Sayood. Introduction to Data Compression. Academic
Press, 2000.
[7] David S. Taubman and Michael W. Marcellin. JPEG2000.
Image compression. Fundamentals, standards and practice.
Kluwer Academic Publishers, 2002.

