Production and Separation of Ethanol: A Didactic Experiment*
advertisement
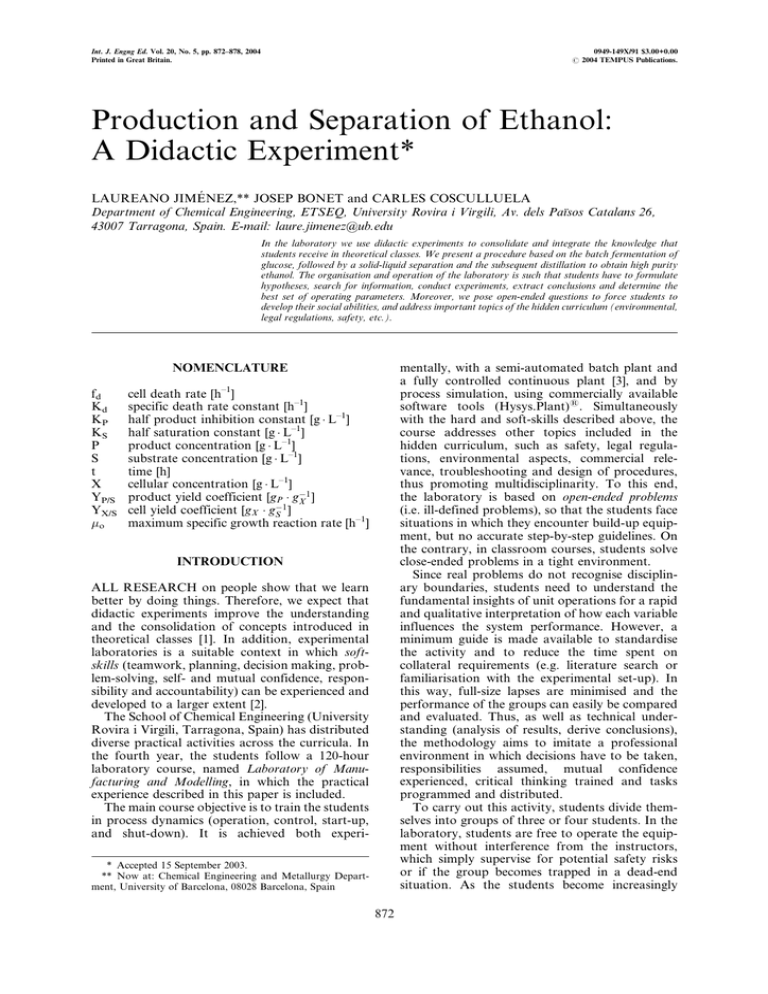
Int. J. Engng Ed. Vol. 20, No. 5, pp. 872±878, 2004 Printed in Great Britain. 0949-149X/91 $3.00+0.00 # 2004 TEMPUS Publications. Production and Separation of Ethanol: A Didactic Experiment* LAUREANO JIMEÂNEZ,** JOSEP BONET and CARLES COSCULLUELA Department of Chemical Engineering, ETSEQ, University Rovira i Virgili, Av. dels PaõÈsos Catalans 26, 43007 Tarragona, Spain. E-mail: laure.jimenez@ub.edu In the laboratory we use didactic experiments to consolidate and integrate the knowledge that students receive in theoretical classes. We present a procedure based on the batch fermentation of glucose, followed by a solid-liquid separation and the subsequent distillation to obtain high purity ethanol. The organisation and operation of the laboratory is such that students have to formulate hypotheses, search for information, conduct experiments, extract conclusions and determine the best set of operating parameters. Moreover, we pose open-ended questions to force students to develop their social abilities, and address important topics of the hidden curriculum (environmental, legal regulations, safety, etc.). mentally, with a semi-automated batch plant and a fully controlled continuous plant [3], and by process simulation, using commercially available software tools (Hysys.Plant)1. Simultaneously with the hard and soft-skills described above, the course addresses other topics included in the hidden curriculum, such as safety, legal regulations, environmental aspects, commercial relevance, troubleshooting and design of procedures, thus promoting multidisciplinarity. To this end, the laboratory is based on open-ended problems (i.e. ill-defined problems), so that the students face situations in which they encounter build-up equipment, but no accurate step-by-step guidelines. On the contrary, in classroom courses, students solve close-ended problems in a tight environment. Since real problems do not recognise disciplinary boundaries, students need to understand the fundamental insights of unit operations for a rapid and qualitative interpretation of how each variable influences the system performance. However, a minimum guide is made available to standardise the activity and to reduce the time spent on collateral requirements (e.g. literature search or familiarisation with the experimental set-up). In this way, full-size lapses are minimised and the performance of the groups can easily be compared and evaluated. Thus, as well as technical understanding (analysis of results, derive conclusions), the methodology aims to imitate a professional environment in which decisions have to be taken, responsibilities assumed, mutual confidence experienced, critical thinking trained and tasks programmed and distributed. To carry out this activity, students divide themselves into groups of three or four students. In the laboratory, students are free to operate the equipment without interference from the instructors, which simply supervise for potential safety risks or if the group becomes trapped in a dead-end situation. As the students become increasingly NOMENCLATURE fd Kd KP KS P S t X YP/S YX/S o cell death rate [h±1] specific death rate constant [h±1] half product inhibition constant [g L±1] half saturation constant [g L±1] product concentration [g L±1] substrate concentration [g L±1] time [h] cellular concentration [g L±1] product yield coefficient [gP gXÿ1 ] cell yield coefficient [gX gSÿ1 ] maximum specific growth reaction rate [h±1] INTRODUCTION ALL RESEARCH on people show that we learn better by doing things. Therefore, we expect that didactic experiments improve the understanding and the consolidation of concepts introduced in theoretical classes [1]. In addition, experimental laboratories is a suitable context in which softskills (teamwork, planning, decision making, problem-solving, self- and mutual confidence, responsibility and accountability) can be experienced and developed to a larger extent [2]. The School of Chemical Engineering (University Rovira i Virgili, Tarragona, Spain) has distributed diverse practical activities across the curricula. In the fourth year, the students follow a 120-hour laboratory course, named Laboratory of Manufacturing and Modelling, in which the practical experience described in this paper is included. The main course objective is to train the students in process dynamics (operation, control, start-up, and shut-down). It is achieved both experi* Accepted 15 September 2003. ** Now at: Chemical Engineering and Metallurgy Department, University of Barcelona, 08028 Barcelona, Spain 872 Production and Separation of Ethanol: A Didactic Experiment familiar with the methodology, trainers focus their activity in posing challenging questions that enforce creative thinking and maintain continuous feedback. The case developed here is the fermentation of glucose with yeast, a typical batch process with multiple processing steps (microorganism activation, reaction, decantation, and distillation) [4, 5]. The former objective is to maximise the ethanol obtained from a given reaction mixture in a fixedtime horizon. However, the underlying objective covered is to acquire the methodology of a semiautomated batch operation (cleaning procedures, liquid handling, checklists and waste disposal). The student tasks are to plan and elaborate the procedure, although some operational constraints should be taken into account. At the end of the experimental work the teams are asked to write a technical report and orally defend their results. MATERIALS AND METHODS Organism and medium The organism used is Saccharomyces cerevisiae, commercialized by AEB IbeÂrica (Barcelona, Spain) as Fermol1 Primeurs. All other chemicals were supplied by PANREAC (Barcelona, Spain). ±D()-glucose 1-hydrate (catalogue no. 143140) was the raw material. Peptone (catalogue no. 403695), was used as a source of nitrogen while CULTIMED yeast extract (catalogue no. 403687) was the nutrient base that provides the peptides that the microorganisms need to synthesise the enzyme. The composition of the medium is 200 g L±1 glucose (concentration of grape juice), 10 g L±1 yeast extract and 10 g L±1 peptone. The pH is adjusted to 3.5 with a tampon dissolution of tartaric acid prepared in the laboratory. o-Toluidine (catalogue no. 252311), a reactive used to determine the glucose in blood, was used to measure the glucose. Proposed reaction kinetics The biochemistry of the microorganism fermentation is very complex and we refer the reader to the biochemical literature for details [6]. Roughly, we can describe the mechanism by considering that initially some oxygen is available in the reaction medium. The yeast population increases and produces the required enzymes oxidising the intermediate pyruvic acid produced in the glycolysis. This oxidation (equation 1) is completed in a set of different steps, liberating energy in biologically usable proportions: yeast 308C C6 H12 O6 ÿÿÿÿÿÿÿ! 6CO2 6H2 O 1 When all the oxygen is consumed, the yeast transforms the pyruvic acid into ethanol (equation 2): yeast 308C ÿÿÿÿÿÿ! 2C2 H5 OH 2CO2 C6 H12 O6 ÿ 2 873 The kinetic expression for equation (2) is similar to the one proposed by Monod [7]. The main difference between them is that the concentration of yeast changes with time, increasing or decreasing according to the conditions (pH, temperature or ethanol concentration), and the activity of the individual cells depend on the concentration of enzymes. Thus, the variations of substrate (S, glucose) is assumed to be proportional to the concentration of active cells (X, active yeast cells), as stated in equation (3): d S S ÿo X dt KS S 3 where o is the maximum specific growth reaction rate (h±1) and KS is the saturation constant (g L±1). The production of ethanol (P) is assumed to be proportional to the rate of substrate consumption (equation 4): d P d S 10 YP=S dt dt 4 where YP/S is the product yield coefficient (mass of product formed per mass of substrate consumed, gP gXÿ1 X ). The ethanol toxicity (around 11% v/v) is introduced as an inactivation rate in the kinetics of the population growth (fd, h±1) as shown in equation 5. Kd 5 fd 1 e11ÿP where Kd is the specific death rate constant (h±1). Furthermore, we can also assume that the population growth is proportional to the rate of substrate consumption, with an active cell yield coefficient YX/S (gX gSÿ1 ). The product also has an inhibitory effect on the population growth, characterised by the half product inhibition constant (KP, g L±1). Thus, rearranging terms we can estimate the active cell population (equation 6): d X S KP YX =S o X dt KS S KP P ÿ fd X 6 The kinetic parameters are shown in Table 1; some of them were retrieved from Colli and Hokka [5], except the values corresponding to equation (5), where the constants were fitted from experimental results obtained in the laboratory. Experimental equipment The equipment was purchased three years ago ( US$55,000) thanks to the special funds provided by the Catalan Government to endow the new teaching facilities at the ETSEQ. The pilot plant (Fig. 1) was engineered by Schott IbeÂrica (Barcelona, Spain). The glass material was supplied by Jenaer Glaswerk GmBh (Jena, Germany), the agitator is made with an IKA Eurostar power digi-visc (IKA Labortechnik, Staufen, L. JimeÂnez, J. Bonet and C. Cosculluela 874 Table 1. Kinetic constants of the proposed model o (hÿ1 ) YX =S gX gSÿ1 KS g Lÿ1 KP g Lÿ1 YP=S gP gSÿ1 Kd hÿ1 1.1 0.03 0.63 6.29 0.0511 1.7 Germany), the vacuum pumps were model ME4 (Vacuubrand Gmbh, Wertheim, Germany) and the heating/cooling system was a F6-C40 model (HAAKE, Karlsruhe, Germany). A PLC (Programmable Logic Controller) manages all aspects concerning the operation. Temperature and pressure of each vessel was controlled independently according to the production steps, stop criteria and the relative priorities set in the control strategy. As a typical discontinuous process, the plant is not fully automated, and therefore, students have to follow a certain procedure for start-up and shut-down (i.e. input valves are manual, while the internal valves can be operated remotely). A glass jacket vessel with a valve in the bottom to facilitate liquid pouring was used for the reaction. The distillation column (50 mm i.d. and 1000 mm height) packed with rashing rings (glass, #6) purifies the ethanol produced in the fermentation. Analytical methods The glucose assay is made following the o-toluidine analytical method [8]. Upon heating (8 minutes at 100oC), o-toluidine reacts with aldosugars in an acidic media to produce a Schift base with a characteristic blue-green colour. o-Toluidine is relatively specific for glucose although it may also react with other hexoses (mannose, galactose) which are present in very low levels in the raw material and consequently, do not interfere. The digestor is the R-8 thermoblock, while the colour intensity measurement is attained by a PF-10 colorimeter at 620 nm, both manufactured by Machery-Nagel GmbH (DuÈren, Germany). A solution of glucose (5 g L±1) is prepared by students, as up to this concentration a linear calibration was found. The analyses of ethanol are carried out in a Hewlett-Packard (California, USA) 5890 Series II Plus gas chromatograph, equipped with a NCD detector with helium as carrier gas. The packed column is a Porapak Q (2 m, 2 mm i.d., 80-mesh, Supelco). The signal is integrated by a HewlettPackard 3396 and related to composition using a calibration curve. This calibration was provided for students, given that time is not sufficient to include this activity. EXPERIMENTAL PROCEDURE We provide the students with the all the chemical costs and ask them to maximise the profit. All groups know in advance the total experimental time, which ranges from three to six days (reaction time varies from one to four days). Students are not allowed to extend their experimental time. After analysing their situation, the students must order the optimal quantity of dry yeast and prepare the reaction media. First, the glucose, the yeast extract and the peptone are dissolved in deionised water and the pH is adjusted. Then 0.5 L of the mixture are extracted and the lyophilised yeast is added. To activate the inoculum, it is heated to 30ëC for fifteen minutes. It is very important not to add the yeast directly to the deionised water to avoid breaking the cells due to the osmotic pressure difference across the cellular membrane. Fig. 1. Scheme of the experimental system. M: mixer; R: cooling water; PCV: on-off pressure control valve; TIC: on-off temperature control valve; XIC: indicator controller; XI: indicator, where X can be temperature, pressure or flowrate. TCV: on-off temperature control valve. Production and Separation of Ethanol: A Didactic Experiment 875 Fig. 2. Typical profile using 8 g L±1 of yeast with one 24 hours reaction time. An agitation of 400 rpm is used to give good mixing properties and avoid any solid deposition with the consequent reduction of efficiency. The reaction temperature is adjusted to 30ëC using an oil-bath. During the reaction, samples are withdrawn to check the reaction extent. As the ethanol analysis by GC is almost instantaneous, the glucose content can be inferred from the stoichiometric calculations and so the dilution of the sample can be chosen to be within calibration limits. Glucose and ethanol analyses allow a qualitative check of the global mass balance, and help to detect erroneous analyses. When the reaction has finished, the solids are separated with a set of laboratory decanters and the liquid is filtered and introduced into the reboiler. Operating conditions for the distillation column had to be fixed by the students. When the operation ends, the top product is weighed and analysed. Once all experiments are finished, the tanks are cleaned with acid and deionised water. Optimum yeast required We provide students with a program developed in DELPHI language that solves the kinetic model using a fourth-order Runge-Kutta method. The program allows changes in the starting conditions and simulates the dynamic behaviour of the system, providing students with the component profile. As an example, Fig. 2 shows the different profiles for a time-horizon of 24 hours. Economy is the main criterion to choose the optimum quantity of yeast and students perform a preliminary economic balance in which the key variables are qualitatively evaluated. It is noteworthy that the work guide does not provide this criterion, and students practice problem solving (low yeast quantities versus long reaction times), creative thinking (why does the yeast concentration decrease?) and decision making (optimal amount of yeast for a fixed reaction time). Fixing the reboiler set-point The mixture is mainly water and ethanol whose azeotrope restricts the operation (90% wt. ethanol at 1 atm). As expected, the azeotrope composition increases when pressure decreases, and therefore most groups decide to work under partial vacuum conditions (up to 0.5 atm), where the azeotrope composition is approximately 92% wt. Some of the experimental work is performed at 0.5 atm. Even so, we always stress that such a strategy (i.e. work under vacuum to realise a 2% composition increase) should be carefully considered in an industrial use. Students systematically tend to fix the set-point of the oil-bath to values around 90ëC, thus considering that a certain temperature gradient is required, even during steady-state operation. In this way, students consider thermodynamic aspects but not kinetic considerations, as the T during start-up is small because the heating system has to heat itself, the unit (glass and iron) and the sample. Moreover, they do not consider that since the ethanol concentration is diminishing, the reboiler temperature will increase. To identify this misconception, Socratic questions are posed (What is the minimum T when you design a heat exchanger? Does energy losses affect these considerations?). The students then realise that they must fix the oil bath at a higher temperature (e.g. 110ëC), which insures that the mixture continues to boil as the ethanol concentration decreases. Top control strategy The top temperature is the key variable in the control strategy that infers the purity of the distillate. The first topic is knowing why this variable is used, instead of a direct composition measurement; the notion of deadtime ( 30 seconds for temperature and 2±8 minutes for online analyzers) and cost (difference of three orders of magnitude) help to ponder the criteria. The top control strategy has a digital selector that automatically changes from the reflux ratio control loop to total reflux operation. Students have to set the cut temperature according to the vaporliquid equilibrium diagram to assure that the product is within specifications (> 75% wt.) [9]. Again questions are posed to check that the L. JimeÂnez, J. Bonet and C. Cosculluela 876 Table 2. Experiment results obtained by students (1999±2000 and 2000±2001) classified according to the reaction time Reaction time/h Dry yeast/g Product/g EtOH/% wt EtOH/% wt stoichiometric Mean* Median Standard dev. 28:9 1 28.0 2.7 24:1 0:4 24.0 1.0 273 34 272 84.5 82:0 2 82.3 4.7 51:8 3 53.6 7.4 Mean* Median Standard dev 47:2 3 47.0 38.0 12:6 2 12.8 2.6 217 71 240 108 84:9 4 88.1 5.8 49:4 12 40.4 14.8 Mean* Median Standard dev. 96:3 1 97.0 2.0 3:0 1 3.1 1.0 233 29 240 41.6 82:0 4 82.6 5.5 46:5 5 47.8 6.8 * Confidence 95%. insights of the control strategy are acquired (i.e. why two different set-points are required? Why there is no top product at the end of the distillation?). Reflux ratio protocol Most groups decide to operate with a fixed reflux ratio, while just a few use a reflux ratio protocol, thus shortening experiments. The typical batch procedure is to compute the minimum reflux ratio that satisfies the purity requirements in the distillate, and increase this value as the ethanol concentration diminishes. In this particular case, the reflux ratio is not very sensitive to feed composition, as the binary vapour-liquid equilibrium plot shows a high relative volatility at low ethanol composition. Methanol was not detected in any experiment, thus introducing a different issue: the selectivity of the reaction. Waste treatment One of the characteristics of the laboratory is the minimum waste production. Waste from the batch plant are fed to the aerobic water treatment plant within the Unit Operations Laboratory in the third year course, while the ethanol produced is used to replenish losses in the continuous distillation pilot plant within the same laboratory [3]. Effectively, the only waste we do not treat in situ is the o-toluidine, which we send to a waste treatment company. RESULTS ANALYSIS In this section we present the results of the academic years 2000±2001 (24 groups) and 1999±2000 (17 groups). In Table 2, different sets of results corresponding to different reaction time (one, two or four days) are shown. We observe that there are small differences between groups, as a consequence of the experimentation with biological systems. Discrepancies may be due to an improper yeast determination or operational problems. In addition, these calculations where useful to detect and identify groups with a bad performance. On average, 71% of the glucose was converted into ethanol, while just 50% of the stoichiometric ethanol was withdrawn as a top product. Regarding the selectivity, the main loss occurs at the very beginning of the reaction phase, where aerobic operation occurs. A covariance analysis of the results was performed, and, as expected, no significant relationship between reaction time and product or purity was observed. Reaction time and yeast had a clear correlation (exponential profile), due to the catalytic effect of the enzymes produced by the microorganisms. The product quantity and purity exhibit a small negative dependence; that is, the more ethanol produced, the more diluted. No significant deviation was detected for the experiments carried out in different years. The data contained in Table 2 is useful to compare among variables, but this approach underscores the weakness of a univariable or bivariable investigation of the data, as these techniques discard valuable information [10]. To overcome this aspect, a multivariate analysis was performed using cluster analysis (CA) and linear discriminant analysis (LDA) to find the grouping of the different experimental sessions. The difference among these techniques is that in LDA groups are defined a priori, while in CA groups are defined by the data. Results are shown in Fig. 3, where a clear pattern is shown, although there are a few groups that obtain results that do not match with the common behaviour (the horizontal axis represents the relative distance between clusters). If the reverse CA analysis is performed, results show very clearly that reaction time, dry yeast and ethanol purity are correlated, while the ethanol produced behave independently of any other variable. A step-wise LDA using as classification criteria the reaction time was performed to check the results from the CA. As expected, the model does not include the ethanol produced in the analysis and classifies 100% of the samples to the course they belong to. CONCLUSIONS The benefits of using practical experiments as didactic tools are diverse [11]. On the one hand, Production and Separation of Ethanol: A Didactic Experiment 877 Fig. 3. Dendrogram using average linkage between groups. The code number indicates the reaction time in hours. students gain confidence in their abilities and, on the other, they improve their understanding of theoretical knowledge through experimentation. Moreover, and very important for the students' future, the course organisation promotes the development of soft skills (creative thinking, problem solving, teamwork and communication). It is noteworthy that several groups operate the same pilot plant and manipulate simultaneously the same PLC, thus improving their responsibility. The course has been very well accepted, testament to which are the many favourable comments that have been received throughout the four years that the laboratory has been running. When the problem is assigned, students that are not familiar with open-ended problem-solving schemes often miss the point, and continuous assessment is required. Hence, instructors act more as counsellors, redirecting students efforts, than as formal teachers of structured knowledge. However, the lack of information forces students to use their own initiative and students realise that there is not a single solution or approach to each problem. The laboratory procedure (preliminary report, analysis, decantation, and separation by distillation) forces students to make a very useful stopand-go, as tasks are performed in different days. Time limitations do not allow peripheral topics to be treated and we provide students with a brief operation manual. The analysis of the results given by the students show that most of them group in a predictable way, and just a few cases are outsiders. Also the multivariate analysis shows that the amount of ethanol produced has no dependence on any other operational variable. This last result was not expected. AcknowledgementsÐThe authors are grateful to Mr. Josep Ma Borras for his help and to Ms. G. Espinosa and Ms. C. Valencia for carrying out some of the kinetic experiments. REFERENCES 1. C. L. McCallum and L. A. EsteÂvez, Introducing process-design elements in the unit operations lab, Chem. Eng. Ed., 33, 1999, pp. 66±70. 2. ABET, Criteria for Accrediting Engineering Programs, Accreditation Board for Engineering and Technology, Baltimore, MD, USA (1999). Available at www.abet.org 3. L. JimeÂnez, A. D. Mackie and J. Giralt, Operation and control of a distillation column as a tool to teach `the real problem', Int. J. of Eng. Ed., 18, 2002, pp. 607±615. 4. M. L. Shuler, N. Mufti, M. Donaldson and R. Taticek, A bioreactor experiment for the senior laboratory, Chem. Eng. Ed., 28, 1994, pp. 24±28. 878 L. JimeÂnez, J. Bonet and C. Cosculluela 5. A. Colli Jr. and C. O. Hokka, Laboratory experiment in biochemical engineering, Chem. Eng. Ed., 33, 1999, pp. 54±70. 6. D. L. Nelson and M. M. Cox, Lehninger Principles of Biochemistry, 3rd ed., Worth Publishing, Cranbury, NJ, USA (2000). 7. H. S. Fogler, Elements of Chemical Reaction Engineering, 2nd ed., Prentice-Hall International, Upper Saddle River, New Jersey, USA (1992). 8. D. Barham and P. Trinder, An improved color reagent for the determination of blood glucose by the oxadase system, Analyst, 97, 1972, pp. 142. 9. J. Gmehling, U. Onken and W. Arlt, Vapor-Liquid Equilibrium Data Collection, Vol. 1a, D. Behrens and R. Eckermann (eds.), Dechema, Frankfurt DE (1981). 10. R. G. Brereton (Ed.), Multivariate Pattern Recognition in Chemometrics Illustrated with Case Studies, Elsevier, Amsterdam, Netherlands (1992). 11. L. JimeÂnez, J. Font, J. Bonet and X. Farriol, A holistic unit operations laboratory, Chem. Eng. Ed., 36, 2002, pp. 150±155. Laureano JimeÂnez is Associate Professor in the Chemical Engineering and Metallurgy Department at the University of Barcelona. He holds a B.Ch. and Ph.D. in Chemistry from the University of Barcelona and has 8 years of experience teaching laboratories. His research interests are process synthesis, modelling, simulation, optimisation and engineering education. Josep Bonet completed both his B.Ch. and Ph.D. in Physics at the University of Barcelona. At present, he is Associate Professor in the Department of Chemical Engineering at URV. His research interests are polymer modeling, molecular simulations and theoretical modeling in soft condensed matter. Carles Cosculluela completed his B.Ch. in Chemical Engineering at the University Rovira i Virgili. At present, he is a researcher at the Servei de Tecnologia QuõÂmica at URV. His research interests are environmental analysis and life cycle analysis.
