6.2 Inverse Functions 1.
advertisement
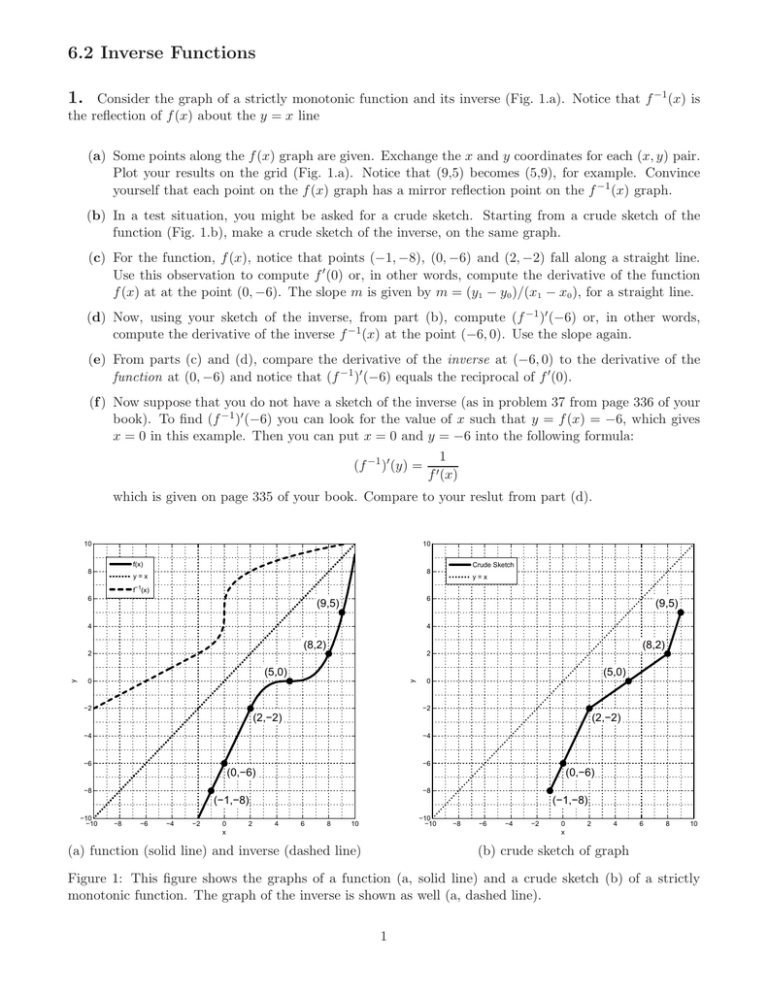
6.2 Inverse Functions 1. Consider the graph of a strictly monotonic function and its inverse (Fig. 1.a). Notice that f −1 (x) is the reflection of f (x) about the y = x line (a) Some points along the f (x) graph are given. Exchange the x and y coordinates for each (x, y) pair. Plot your results on the grid (Fig. 1.a). Notice that (9,5) becomes (5,9), for example. Convince yourself that each point on the f (x) graph has a mirror reflection point on the f −1 (x) graph. (b) In a test situation, you might be asked for a crude sketch. Starting from a crude sketch of the function (Fig. 1.b), make a crude sketch of the inverse, on the same graph. (c) For the function, f (x), notice that points (−1, −8), (0, −6) and (2, −2) fall along a straight line. Use this observation to compute f ′ (0) or, in other words, compute the derivative of the function f (x) at at the point (0, −6). The slope m is given by m = (y1 − y0 )/(x1 − x0 ), for a straight line. (d) Now, using your sketch of the inverse, from part (b), compute (f −1 )′ (−6) or, in other words, compute the derivative of the inverse f −1 (x) at the point (−6, 0). Use the slope again. (e) From parts (c) and (d), compare the derivative of the inverse at (−6, 0) to the derivative of the function at (0, −6) and notice that (f −1 )′ (−6) equals the reciprocal of f ′ (0). (f ) Now suppose that you do not have a sketch of the inverse (as in problem 37 from page 336 of your book). To find (f −1 )′ (−6) you can look for the value of x such that y = f (x) = −6, which gives x = 0 in this example. Then you can put x = 0 and y = −6 into the following formula: 1 (f −1 )′ (y) = ′ f (x) which is given on page 335 of your book. Compare to your reslut from part (d). 10 10 f(x) 8 Crude Sketch 8 y=x y=x f−1(x) 6 6 (9,5) 4 (9,5) 4 (8,2) (8,2) 2 2 (5,0) y y (5,0) 0 −2 0 −2 (2,−2) (2,−2) −4 −4 −6 −6 (0,−6) (0,−6) −8 −8 (−1,−8) −10 −10 −8 −6 −4 −2 0 x 2 (−1,−8) 4 6 8 −10 −10 10 (a) function (solid line) and inverse (dashed line) −8 −6 −4 −2 0 x 2 4 6 8 10 (b) crude sketch of graph Figure 1: This figure shows the graphs of a function (a, solid line) and a crude sketch (b) of a strictly monotonic function. The graph of the inverse is shown as well (a, dashed line). 1
