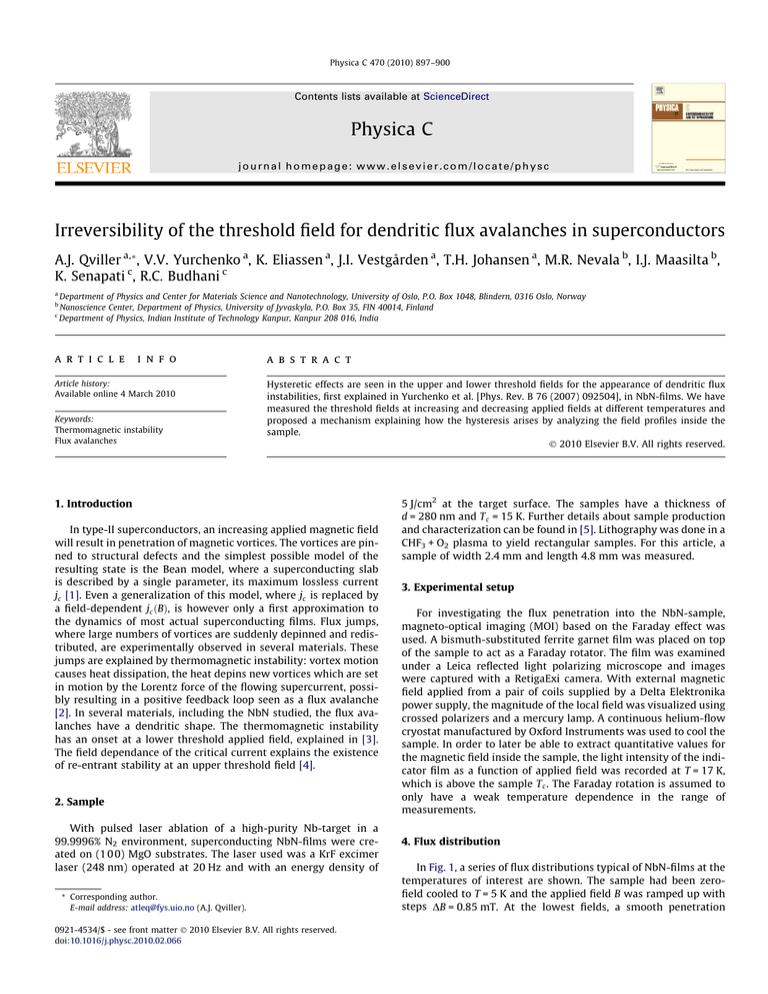
Physica C 470 (2010) 897–900
Contents lists available at ScienceDirect
Physica C
journal homepage: www.elsevier.com/locate/physc
Irreversibility of the threshold field for dendritic flux avalanches in superconductors
A.J. Qviller a,*, V.V. Yurchenko a, K. Eliassen a, J.I. Vestgården a, T.H. Johansen a, M.R. Nevala b, I.J. Maasilta b,
K. Senapati c, R.C. Budhani c
a
Department of Physics and Center for Materials Science and Nanotechnology, University of Oslo, P.O. Box 1048, Blindern, 0316 Oslo, Norway
Nanoscience Center, Department of Physics, University of Jyvaskyla, P.O. Box 35, FIN 40014, Finland
c
Department of Physics, Indian Institute of Technology Kanpur, Kanpur 208 016, India
b
a r t i c l e
i n f o
Article history:
Available online 4 March 2010
Keywords:
Thermomagnetic instability
Flux avalanches
a b s t r a c t
Hysteretic effects are seen in the upper and lower threshold fields for the appearance of dendritic flux
instabilities, first explained in Yurchenko et al. [Phys. Rev. B 76 (2007) 092504], in NbN-films. We have
measured the threshold fields at increasing and decreasing applied fields at different temperatures and
proposed a mechanism explaining how the hysteresis arises by analyzing the field profiles inside the
sample.
Ó 2010 Elsevier B.V. All rights reserved.
1. Introduction
In type-II superconductors, an increasing applied magnetic field
will result in penetration of magnetic vortices. The vortices are pinned to structural defects and the simplest possible model of the
resulting state is the Bean model, where a superconducting slab
is described by a single parameter, its maximum lossless current
jc [1]. Even a generalization of this model, where jc is replaced by
a field-dependent jc ðBÞ, is however only a first approximation to
the dynamics of most actual superconducting films. Flux jumps,
where large numbers of vortices are suddenly depinned and redistributed, are experimentally observed in several materials. These
jumps are explained by thermomagnetic instability: vortex motion
causes heat dissipation, the heat depins new vortices which are set
in motion by the Lorentz force of the flowing supercurrent, possibly resulting in a positive feedback loop seen as a flux avalanche
[2]. In several materials, including the NbN studied, the flux avalanches have a dendritic shape. The thermomagnetic instability
has an onset at a lower threshold applied field, explained in [3].
The field dependance of the critical current explains the existence
of re-entrant stability at an upper threshold field [4].
2. Sample
With pulsed laser ablation of a high-purity Nb-target in a
99.9996% N2 environment, superconducting NbN-films were created on (1 0 0) MgO substrates. The laser used was a KrF excimer
laser (248 nm) operated at 20 Hz and with an energy density of
* Corresponding author.
E-mail address: atleq@fys.uio.no (A.J. Qviller).
0921-4534/$ - see front matter Ó 2010 Elsevier B.V. All rights reserved.
doi:10.1016/j.physc.2010.02.066
5 J/cm2 at the target surface. The samples have a thickness of
d = 280 nm and T c = 15 K. Further details about sample production
and characterization can be found in [5]. Lithography was done in a
CHF3 + O2 plasma to yield rectangular samples. For this article, a
sample of width 2.4 mm and length 4.8 mm was measured.
3. Experimental setup
For investigating the flux penetration into the NbN-sample,
magneto-optical imaging (MOI) based on the Faraday effect was
used. A bismuth-substituted ferrite garnet film was placed on top
of the sample to act as a Faraday rotator. The film was examined
under a Leica reflected light polarizing microscope and images
were captured with a RetigaExi camera. With external magnetic
field applied from a pair of coils supplied by a Delta Elektronika
power supply, the magnitude of the local field was visualized using
crossed polarizers and a mercury lamp. A continuous helium-flow
cryostat manufactured by Oxford Instruments was used to cool the
sample. In order to later be able to extract quantitative values for
the magnetic field inside the sample, the light intensity of the indicator film as a function of applied field was recorded at T = 17 K,
which is above the sample T c . The Faraday rotation is assumed to
only have a weak temperature dependence in the range of
measurements.
4. Flux distribution
In Fig. 1, a series of flux distributions typical of NbN-films at the
temperatures of interest are shown. The sample had been zerofield cooled to T = 5 K and the applied field B was ramped up with
steps DB = 0.85 mT. At the lowest fields, a smooth penetration
898
A.J. Qviller et al. / Physica C 470 (2010) 897–900
Fig. 1. Flux distributions at T = 5 K at different applied fields B.
Fig. 2. Phase diagram showing threshold fields for thermomagnetic instability at
increasing and decreasing fields as function of temperature. Maximum applied field
is 85.0 mT, resolution 0.85 mT. Legend: " = Ascending field, # = Descending field.
similar to the Bean model was seen, but this regime ended at
B = 2.55 mT, where the onset of thermomagnetic instability
manifested itself as a flux avalanche appearing. At higher field
B = 11.9 mT several more dendrites had appeared. The stability
was regained at B = 41.7 mT and no new dendrites was seen at
even higher fields. A Bean model like penetration pattern was instead gradually restored as shown in the image captured at
B = 68.0 mT. After reaching the highest field (B = 85.0 mT, not
shown), the field was decreased, initially without dendrites
Fig. 3. Two threshold fields are defined by the intersection of jc ðBÞ and Hth ðjc Þ.
appearing. The image captured at B = 75.7 mT is representative of
this Bean-model regime. At B = 60.4 mT, the first dendrite in
descending field appeared. In the following, new dendrites were
seen all the way down to B = 0 mT.
5. Phase diagram of thermomagnetic instability
Flux distributions at increasing and decreasing applied fields in
the interval of temperatures from T = 4 K to T = 10 K were measured, and regimes of thermomagnetic instability and stability
were recorded. The results are shown in Fig. 2. It is seen that for
899
A.J. Qviller et al. / Physica C 470 (2010) 897–900
3.5
↑
↓
3
2.5
4πBz/μ0
2
1.5
1
0.5
0
−0.5
−1
−3
−2
−1
0
1
2
3
x (mm)
Fig. 5. Modification of Fig. 3 in order to take into account the internal field profiles
from Fig. 4.
Fig. 4. Increasing (") and decreasing (#) applied magnetic field profiles across the
2.4 mm wide sample centered at x = 0. Schematic drawing.
↑
↓
120
|B| (mT)
100
80
60
40
20
0
220
200
Intensity (arbitrary units)
all measured temperatures in the interval between 4 K and 8 K,
there is a substantial hysteresis in the upper threshold fields for
increasing and decreasing applied field, while the lower threshold
fields are closer, but not exactly identical. In order to explain the
hysteresis, a recapitulation of the theory from [4] explaining re-entrant thermomagnetic stability is required. At low critical currents,
the threshold field cannot be reached and the superconductor is
stable against avalanches. But at higher critical currents, there will
be lower and upper threshold fields for the instability, as seen in
Fig. 3. The critical current decreases as the temperature rises towards T c , such that the upper and lower threshold fields will converge towards the always-stable regime, as seen in Fig. 3. In order
to extend the model from [4], the magnetic field profiles inside the
superconductor are considered. They are obtained from direct integration of Biot–Savart’s law and are shown schematically in Fig. 4
for the special case of the Bean model (field independent jc ). As the
180
160
140
120
100
80
60
40
−1
−0.5
0
x (mm)
0.5
1
20
0
10
20
30
40
50
60
70
80
90
B (mT)
Fig. 6. Field distributions with transverse profiles. Upper left: before the last dendrite in increasing fields. Upper right: before the first dendrite in decreasing fields. Lower left:
(" = Increasing field, # = Decreasing field). Lower right: intensity calibration data with fit for a single pixel.
900
A.J. Qviller et al. / Physica C 470 (2010) 897–900
applied field is increased from zero, magnetic flux builds up just
outside the film, sketched as the red1 graph in Fig. 4. Inside the
superconductor, the local field value depends on the critical current,
which itself generally is a function of temperature and field and results from a self-consistent solution. The avalanches are formed
close to the edges of the samples and therefore the important
parameter is the local field in this region. As the sample is fully penetrated and the applied field is decreased, the currents close to the
edges will reverse direction, resulting in minima in the field profile
near the edges and sketched as the blue graph in Fig. 4. Thus, at a
higher applied field at decreasing fields, the local field at the edge
of the superconducting film is numerically similar to a lower applied
field at increasing fields due to the different field profiles in increasing and decreasing fields. The critical current has generally a monotonic field dependence and will thus also have similar values at the
edges for different applied fields, causing hysteresis in threshold
fields for dendrite nucleation. Fig. 3 must therefore be modified to
account for a higher critical current at the edge of the sample in
decreasing applied fields compared to increasing applied fields and
the result is seen in Fig. 5. The upper threshold fields differ substantially when this modification of the model is made and a higher
upper threshold are seen at decreasing applied fields than at increasing applied fields. On the other hand, in this particular sample, the
lower threshold field changes very little with increasing and increasing fields, as seen in Fig. 2.
I(x, y) of the superconducting phase below T c were solved for
Bz (x, y) by using the previously obtained coefficients. Transverse
slices of this picture, showing field profiles, were extracted. This
was done at the image before the last dendrite appearing in
increasing fields and before the first dendrite appearing in decreasing fields. Slices were obtained at all temperatures in the interval
between T = 4 K and T = 8 K, corresponding to Fig. 2. In Fig. 6 the
profiles measured at T = 5 K are plotted. The magnetic fields at
the edges are seen to be nearly equal, even if the externally applied
fields differ substantially (Fig. 1). These results are representative
of the measurements at the other temperatures.
7. Conclusion
It was hypothesized that the observed hysteresis in the threshold fields for the appearance of dendritic flux instabilities in superconducting NbN was caused by a combination of the different
internal field profiles in increasing and decreasing fields together
with the existence of upper and lower threshold fields for the onset
of thermomagnetic instability. In this model, different applied
fields gives rise to identical local fields. A magneto-optical investigation of an NbN-sample provides clear evidence that the local
field at the edge of the sample is the parameter that matters for
triggering dendritic flux instabilities.
Acknowledgment
6. Field profiles
The field profiles inside the sample had to be reconstructed, in
order to experimentally check whether the hysteresis in the upper
threshold field collapses when the local field at the edge of the
sample instead of the applied field is examined, and thus confirm
the above hypothesis. In order to do this, the magneto-optical
images were calibrated. This was done by extracting the light
intensity I(x, y) response of the indicator film as a function of the
applied Bz (x, y) above T c of the superconductor. For each pixel,
the measured intensity was fitted to the light response function
of the indicator film, given by Jooss et al. [6]. When the intensity
function of all pixels in the image was obtained, intensity images
1
For interpretation of color in Figs. 2–6, the reader is referred to the web version of
this article.
This work was supported by the Norwegian Research Council
Grant No. 158518/431 (NANOMAT).
References
[1] C.P. Bean, Rev. Mod. Phys. 36 (1964) 31.
[2] R.G. Mints, A.L. Rakhmanov, Rev. Mod. Phys. 53 (1981) 551.
[3] D.V. Denisov, D.V. Shantsev, Y.M. Galperin, E.-M. Choi, H.-S. Lee, S.-Ik. Lee, A.V.
Bobyl, P.E. Goa, A.A.F. Olsen, T.H. Johansen, Phys. Rev. Lett. 97 (2006) 077002.
[4] V.V. Yurchenko, D.V. Shantsev, T.H. Johansen, M.R. Nevala, I.J. Maasilta, K.
Senapati, R.C. Budhani, Phys. Rev. B 76 (2007) 092504.
[5] K. Senapati, N.K. Pandey, R. Nagar, R.C. Budhani, Phys. Rev. B 74 (2006) 104514.
[6] Ch. Jooss, J. Albrecht, H. Kuhn, S. Leonhardt, H. Kronmuller, Rep. Prog. Phys. 65
(2002) 675.


