Indicator 3.16.
advertisement

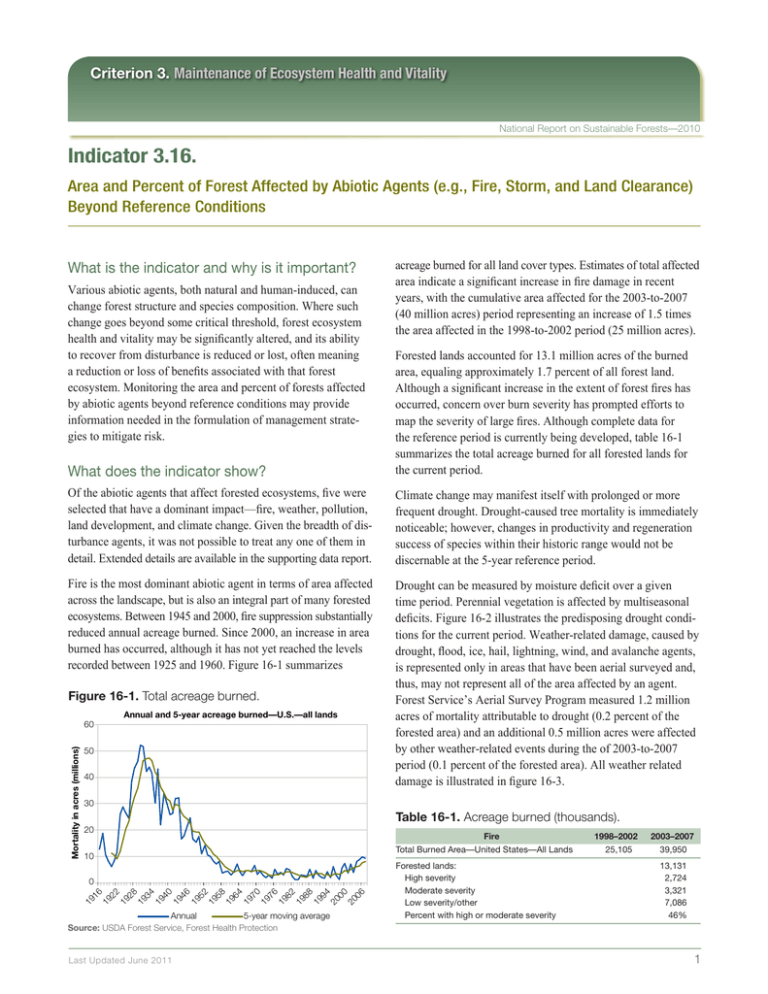
Criterion 3. Maintenance of Ecosystem Health and Vitality National Report on Sustainable Forests—2010 Indicator 3.16. Area and Percent of Forest Affected by Abiotic Agents (e.g., Fire, Storm, and Land Clearance) Beyond Reference Conditions What is the indicator and why is it important? Various abiotic agents, both natural and human-induced, can change forest structure and species composition. Where such change goes beyond some critical threshold, forest ecosystem health and vitality may be significantly altered, and its ability to recover from disturbance is reduced or lost, often meaning a reduction or loss of benefits associated with that forest ecosystem. Monitoring the area and percent of forests affected by abiotic agents beyond reference conditions may provide information needed in the formulation of management strategies to mitigate risk. acreage burned for all land cover types. Estimates of total af­fected area indicate a significant increase in fire damage in recent years, with the cumulative area affected for the 2003-to-2007 (40 million acres) period representing an increase of 1.5 times the area affected in the 1998-to-2002 period (25 million acres). What does the indicator show? Forested lands accounted for 13.1 million acres of the burned area, equaling approximately 1.7 percent of all forest land. Although a significant increase in the extent of forest fires has occurred, concern over burn severity has prompted efforts to map the severity of large fires. Although complete data for the reference period is currently being developed, table 16-1 summarizes the total acreage burned for all forested lands for the current period. Of the abiotic agents that affect forested ecosystems, five were selected that have a dominant impact—fire, weather, pollution, land development, and climate change. Given the breadth of dis­turbance agents, it was not possible to treat any one of them in detail. Extended details are available in the supporting data report. Climate change may manifest itself with prolonged or more frequent drought. Drought-caused tree mortality is immediately noticeable; however, changes in productivity and regeneration success of species within their historic range would not be discernable at the 5-year reference period. Fire is the most dominant abiotic agent in terms of area affected across the landscape, but is also an integral part of many forested ecosystems. Between 1945 and 2000, fire suppression substantially reduced annual acreage burned. Since 2000, an increase in area burned has occurred, although it has not yet reached the levels recorded between 1925 and 1960. Figure 16-1 summarizes Drought can be measured by moisture deficit over a given time period. Perennial vegetation is affected by multiseasonal deficits. Figure 16-2 illustrates the predisposing drought conditions for the current period. Weather-related damage, caused by drought, flood, ice, hail, lightning, wind, and avalanche agents, is represented only in areas that have been aerial surveyed and, thus, may not represent all of the area affected by an agent. Forest Service’s Aerial Survey Program measured 1.2 million acres of mortality attributable to drought (0.2 percent of the forested area) and an additional 0.5 million acres were affected by other weather-related events during the of 2003-to-2007 period (0.1 percent of the forested area). All weather related damage is illustrated in figure 16-3. Figure 16-1. Total acreage burned. Annual and 5-year acreage burned—U.S.—all lands Mortality in acres (millions) 60 50 40 30 Table 16-1. Acreage burned (thousands). 20 Fire Total Burned Area—United States––All Lands 10 Annual 5-year moving average Source: USDA Forest Service, Forest Health Protection Last Updated June 2011 06 00 20 94 20 88 19 82 19 76 19 70 19 64 19 58 19 52 19 46 19 40 19 34 19 28 19 22 19 19 19 16 0 Forested lands: High severity Moderate severity Low severity/other Percent with high or moderate severity 1998–2002 25,105 2003–2007 39,950 13,131 2,724 3,321 7,086 46% 1 National Report on Sustainable Forests—2010 Figure 16-2. Drought conditions, 5-year period. Figure 16-3. Surveyed weather damage. Drought condition within U.S. forested areas, 2003–2007 Abiotic forest damage areas, 2003–2007 Surplus Normal Mild deficit Moderate deficit Severe deficit Extreme deficit Source: USDA Forest Service, Forest Health Protection Insect and Disease Survey abiotic damage Source: USDA Forest Service, Forest Health Protection Pollution effects on forests are indicated by Critical Acid Loading (CAL), which incorporates SO4 and NO3 and their relationship with soil properties. From 1994 to 2000, 74 million acres, or 17 percent of U.S. forest soils exceeded their CAL by more than 98.4 equivalents per acre per year. These areas are predominately located in the Northeastern United States (McNulty et al. 2007; see also Indicator 19). Surface ozone (O3) is also an important air pollutant that affects vegetation. No evidence exists linking Forest Health Monitoring ozone bioindicator response data to a specific tree health problem or regional decline. Nevertheless, mapped data demonstrate that concentrations of plant damaging ozone air pollution are widespread in parts of the United States (Coulston 2005). In 2000, 31 million forested acres existed in urban and suburban (less than 1.68 acres per residential housing unit) areas in the coterminous USA, but slightly more than seven times that (226 million acres) existed in exurban areas (between 1.68 and 39.98 acres per residential housing unit). From 1980 to 2000, the developed footprint has grown from 10.1 to 13.3 percent of forest land, roughly by 1.6 percent per year. This rate of land development outpaced the population growth rate (1.18 percent per year) by 25 percent. Based on model forecasts, urban and suburban housing densities will expand 2.2 percent by 2020, whereas exurban development on forest land will expand by 14.3 percent (Theobald 2005). What has changed since 2003? For burned area, the current period shows an increase over the reference period (table 16-2); however, both of these periods are substantially less than the historic 5-year period maximum that occurred in the late 1920s, as illustrated in figure 16-1. Weather-related damage has increased during the past 5-year period (788,429 acres versus 1,760,885 acres) with drought exhibiting the largest proportion in acreage affected. Land clearing for urbanization continues to expand by 1.6 percent per year. Are there important regional differences? Burn severity data spanning from 1984 to 2007 has been tabulated for the Rocky Mountain and Pacific Regions. Over the past 24 years, the proportion of moderate and high burn severity on forested lands has increased from a proportion of 31 to 50 percent of the burned forested area (table 16-2). Burn severity for the Southern Region over the reference and current periods has declined (table 16-3). Table 16-3. Burn severity (acres in thousands). Burn Severity on Forested Lands––Southern Region 1998–2002 High Moderate Other Percent with high or moderate severity 7 31 186 17% 2003–2007 25 144 1,235 12% Table 16-2. Burn severity (acres in thousands). Fire Burned Area––United States All Lands Burn severity on forested lands––Western Region High Moderate Other Percent with high or moderate severity Last Updated June 2011 1983–1987 1988–1992 1993–1997 1998–2002 2003–2007 10,535 16,482 16,635 25,105 39,950 140 211 771 31% 311 229 970 36% 187 244 985 30% 926 929 2,267 45% 1,702 1,476 3,234 50% 2

