Math4020 Experimental Probabilities Worksheet
advertisement
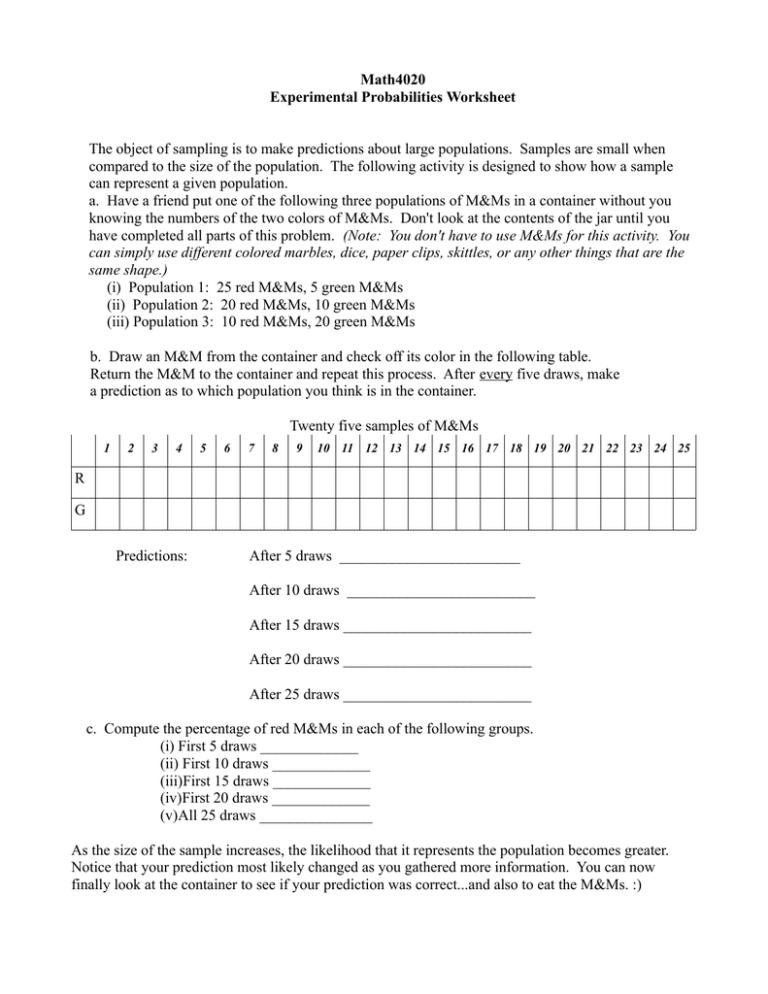
Math4020 Experimental Probabilities Worksheet The object of sampling is to make predictions about large populations. Samples are small when compared to the size of the population. The following activity is designed to show how a sample can represent a given population. a. Have a friend put one of the following three populations of M&Ms in a container without you knowing the numbers of the two colors of M&Ms. Don't look at the contents of the jar until you have completed all parts of this problem. (Note: You don't have to use M&Ms for this activity. You can simply use different colored marbles, dice, paper clips, skittles, or any other things that are the same shape.) (i) Population 1: 25 red M&Ms, 5 green M&Ms (ii) Population 2: 20 red M&Ms, 10 green M&Ms (iii) Population 3: 10 red M&Ms, 20 green M&Ms b. Draw an M&M from the container and check off its color in the following table. Return the M&M to the container and repeat this process. After every five draws, make a prediction as to which population you think is in the container. Twenty five samples of M&Ms 1 2 3 4 5 6 7 8 9 10 11 12 13 14 15 16 17 18 19 20 21 22 23 24 25 R G Predictions: After 5 draws ________________________ After 10 draws _________________________ After 15 draws _________________________ After 20 draws _________________________ After 25 draws _________________________ c. Compute the percentage of red M&Ms in each of the following groups. (i) First 5 draws _____________ (ii) First 10 draws _____________ (iii)First 15 draws _____________ (iv)First 20 draws _____________ (v)All 25 draws _______________ As the size of the sample increases, the likelihood that it represents the population becomes greater. Notice that your prediction most likely changed as you gathered more information. You can now finally look at the container to see if your prediction was correct...and also to eat the M&Ms. :)
