AccuTOF Mass Spectrometers Elemental Compositions from Exact Mass
advertisement
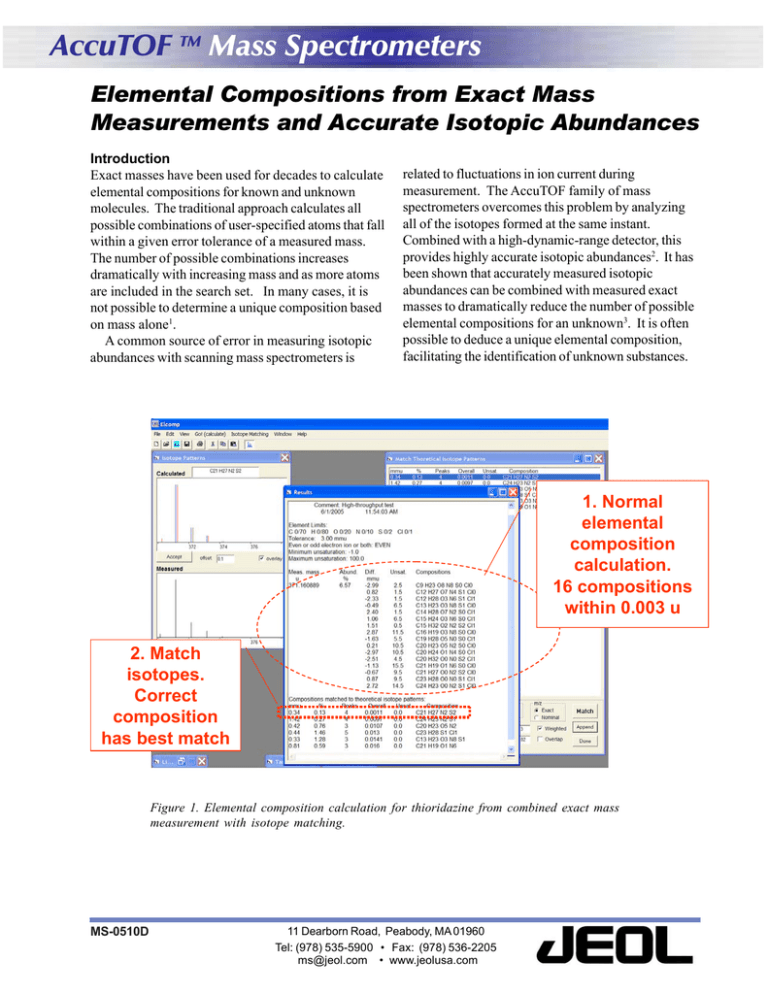
AccuTOF TM Mass Spectrometers Elemental Compositions from Exact Mass Measurements and Accurate Isotopic Abundances Introduction Exact masses have been used for decades to calculate elemental compositions for known and unknown molecules. The traditional approach calculates all possible combinations of user-specified atoms that fall within a given error tolerance of a measured mass. The number of possible combinations increases dramatically with increasing mass and as more atoms are included in the search set. In many cases, it is not possible to determine a unique composition based on mass alone1. A common source of error in measuring isotopic abundances with scanning mass spectrometers is related to fluctuations in ion current during measurement. The AccuTOF family of mass spectrometers overcomes this problem by analyzing all of the isotopes formed at the same instant. Combined with a high-dynamic-range detector, this provides highly accurate isotopic abundances2. It has been shown that accurately measured isotopic abundances can be combined with measured exact masses to dramatically reduce the number of possible elemental compositions for an unknown3. It is often possible to deduce a unique elemental composition, facilitating the identification of unknown substances. 1. Normal elemental composition calculation. 16 compositions within 0.003 u 2. Match isotopes. Correct composition has best match Figure 1. Elemental composition calculation for thioridazine from combined exact mass measurement with isotope matching. MS-0510D 11 Dearborn Road, Peabody, MA 01960 Tel: (978) 535-5900 • Fax: (978) 536-2205 ms@jeol.com • www.jeolusa.com Experimental Samples in this report were measured with the AccuTOF-DARTtm mass spectrometer. Similar procedures can be used with other members of the AccuTOF mass spectrometer family. Calibrated mass spectra were centroided and saved as JEOL-DX (JCAMP) text files. These text files were processed with the Elemental Composition Workshop from the Mass Spec Toolstm software suite distributed with AccuTOF mass spectrometers4. The program permits automated isotope matching for measured mass spectra and provides a visual comparison between the measured and theoretical isotopic abundances for each hit (Figure 1). Eleven small drug samples were deposited on melting point tubes and mounted on a support. Samples were passed sequentially in front of the DART source with a measurement time of about 3 seconds per sample. Neat PEG 600 on a melting point tube was also measured to provide an external Compound Phenolphthalein Promazine Quinine Nortrityplene Thioridazine Chlorpromazine Doxepin Hydrocortisone Reserpine Caffeine Erythromycin Composition C20H15O4 C17H21N2S C20H25N2O2 C19H22N C21H27N2S2 C17H20N2SCl C19H22NO C21H31O5 C33H41N2O9 C8H11N4O2 C37H68NO13 mass calibration standard. Elemental compositions were calculated by assuming even-electron ions, a mass measurement error tolerance of 0.003 u, and default tolerances for isotope matching. Elemental limits were set to: C 0/70 H 0/80 O 0/20 N 0/10 S 0/2 Cl 0/1. The correct elemental composition was successfully determined for each sample as shown in Table 1. The total number of compositions calculated without isotope matching is shown in column 4 of the table. The correct composition was the number 1 ranked composition from the automated isotope match for all compounds measured. The most dramatic example was reserpine [M+H]+ (C33H41N2O9) which gave 30 compositions without isotope matching. Isotope matching reduced the number of possible compositions to 11 of which the best match corresponded to the correct composition. Calculated m/z 319.097035 285.142544 325.191603 264.175224 371.161565 319.103572 280.170139 363.21715 609.281208 195.088201 734.469069 #Compositions 18 11 8 5 16 18 5 9 30 7 22 Rank 1 1 1 1 1 1 1 1 1 1 1 Table I. [M+H]+ elemental compositions determined for 11 drugs measured in 0.58 minutes with the AccuTOF-DART. All compositions were correctly identified. The rms mass measurement error was 2.2 ppm. References 1. 2. 3. 4. http://jeolusa.com/ms/docs/elcomp.html http://jeolusa.com/ms/docs/phenylalanine.pdf http://www.epa.gov/nerlesd1/chemistry/ice/pubs.htm JEOL USA, Inc. customers only. The software is available to all for purchase at http://www.chemsw.com/13057.htm MS-0510D-2 11 Dearborn Road, Peabody, MA 01960 Tel: (978) 535-5900 • Fax: (978) 536-2205 ms@jeol.com • www.jeolusa.com
