Professional, Administrative, and Support Staff Personnel By Gender, Fall 2004
advertisement
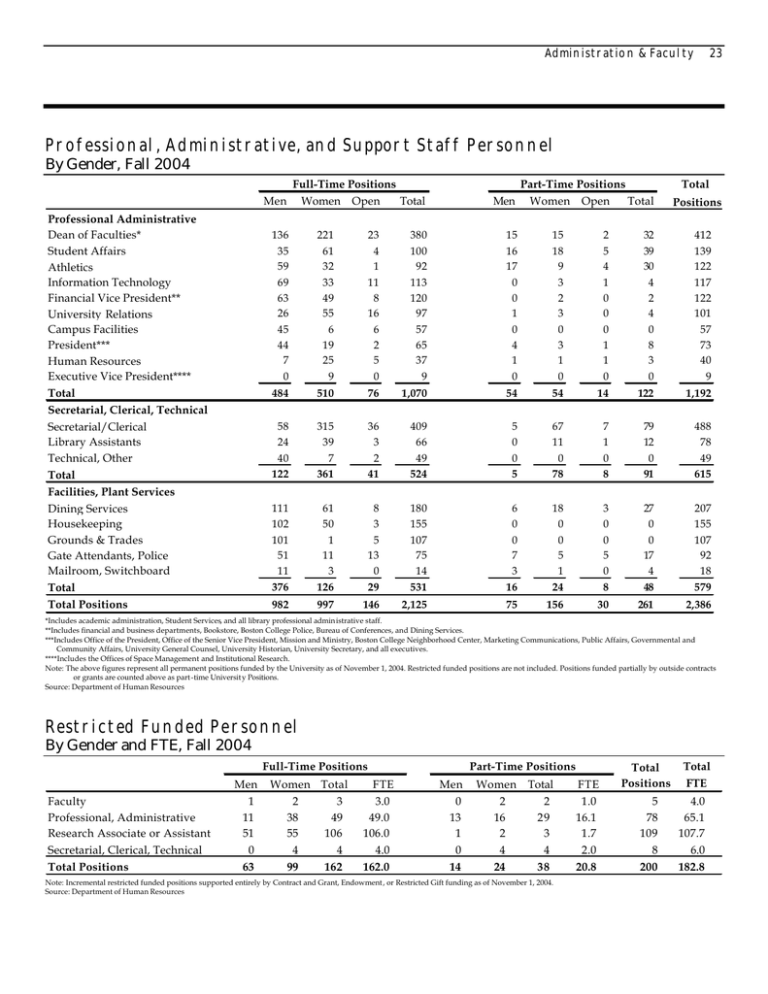
Administration & Faculty 23 Professional, Administrative, and Support Staff Personnel By Gender, Fall 2004 Full-Time Positions Women Open Total Men Professional Administrative Dean of Faculties* Student Affairs Athletics Information Technology Financial Vice President** University Relations Campus Facilities President*** Human Resources Executive Vice President**** Total Secretarial, Clerical, Technical Secretarial/Clerical Library Assistants Technical, Other Total Facilities, Plant Services Dining Services Housekeeping Grounds & Trades Gate Attendants, Police Mailroom, Switchboard Total Total Positions Men Part-Time Positions Women Open Total Total Positions 136 35 59 69 63 26 45 44 7 0 221 61 32 33 49 55 6 19 25 9 23 4 1 11 8 16 6 2 5 0 380 100 92 113 120 97 57 65 37 9 15 16 17 0 0 1 0 4 1 0 15 18 9 3 2 3 0 3 1 0 2 5 4 1 0 0 0 1 1 0 32 39 30 4 2 4 0 8 3 0 412 139 122 117 122 101 57 73 40 9 484 510 76 1,070 54 54 14 122 1,192 58 24 40 122 315 39 7 361 36 3 2 41 409 66 49 524 5 0 0 5 67 11 0 78 7 1 0 8 79 12 0 91 488 78 49 615 111 102 101 51 11 376 61 50 1 11 3 126 8 3 5 13 0 29 180 155 107 75 14 531 6 0 0 7 3 16 18 0 0 5 1 24 3 0 0 5 0 8 27 0 0 17 4 48 207 155 107 92 18 579 982 997 146 2,125 75 156 30 261 2,386 *Includes academic administration, Student Services, and all library professional admin istrative staff. **Includes financial and business departments, Bookstore, Boston College Police, Bureau of Conferences, and Dining Services. ***Includes Office of the President, Office of the Senior Vice President, Mission and Ministry, Boston College Neighborhood Center, Marketing Communications, Public Affairs, Governmental and Community Affairs, University General Counsel, University Historian, University Secretary, and all executives. ****Includes the Offices of Space Management and Institutional Research. Note: The above figures represent all permanent positions funded by the University as of November 1, 2004. Restricted funded positions are not included. Positions funded partially by outside contracts or grants are counted above as part -time Universit y Positions. Source: Department of Human Resources Restricted Funded Personnel By Gender and FTE, Fall 2004 Full-Time Positions Men Faculty Professional, Administrative Research Associate or Assistant Secretarial, Clerical, Technical Total Positions 1 11 51 Women Total 2 38 55 3 49 106 Part-Time Positions FTE 3.0 49.0 106.0 Men 0 13 1 Women 2 16 2 Total FTE Total Positions 2 29 3 1.0 16.1 1.7 5 78 109 Total FTE 4.0 65.1 107.7 0 4 4 4.0 0 4 4 2.0 8 6.0 63 99 162 162.0 14 24 38 20.8 200 182.8 Note: Incremental restricted funded positions supported entirely by Contract and Grant, Endowment , or Restricted Gift funding as of November 1, 2004. Source: Department of Human Resources
