HYDROLOGY OF BISHOP CREEK, CALIFORNIA: AN ISOTOPIC ANALYSIS
advertisement

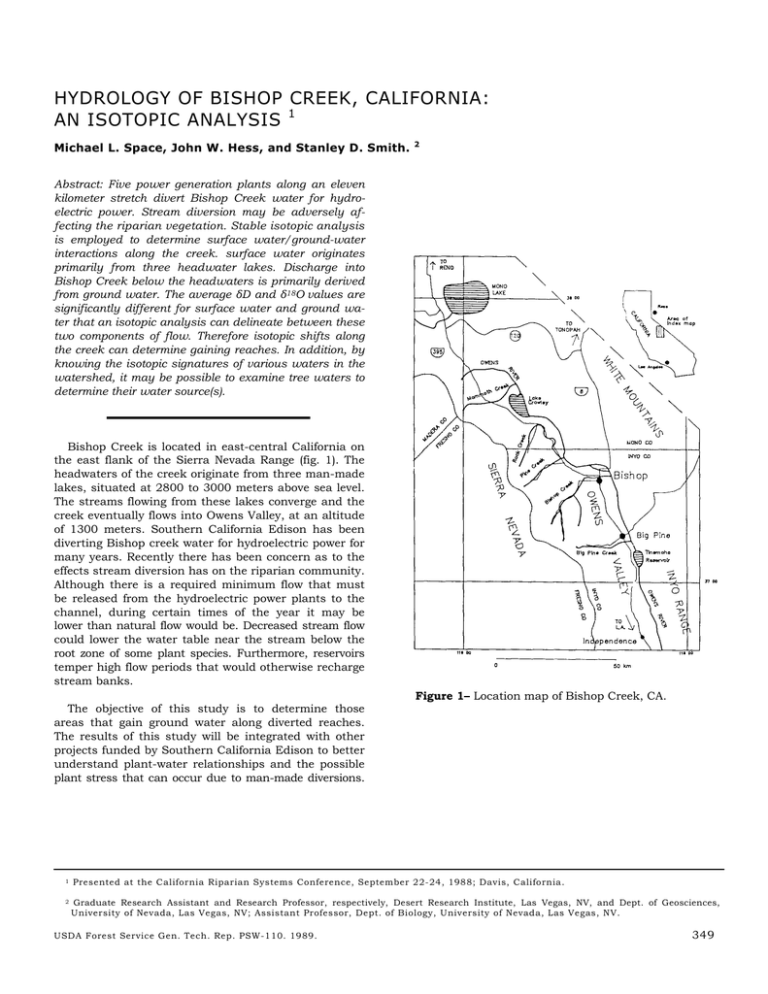
HYDROLOGY OF BISHOP CREEK, CALIFORNIA: AN ISOTOPIC ANALYSIS 1 Michael L. Space, John W. Hess, and Stanley D. Smith. 2 Abstract: Five power generation plants along an eleven kilometer stretch divert Bishop Creek water for hydroelectric power. Stream diversion may be adversely affecting the riparian vegetation. Stable isotopic analysis is employed to determine surface water/ground-water interactions along the creek. surface water originates primarily from three headwater lakes. Discharge into Bishop Creek below the headwaters is primarily derived from ground water. The average δD and δ18O values are significantly different for surface water and ground water that an isotopic analysis can delineate between these two components of flow. Therefore isotopic shifts along the creek can determine gaining reaches. In addition, by knowing the isotopic signatures of various waters in the watershed, it may be possible to examine tree waters to determine their water source(s). Bishop Creek is located in east-central California on the east flank of the Sierra Nevada Range (fig. 1). The headwaters of the creek originate from three man-made lakes, situated at 2800 to 3000 meters above sea level. The streams flowing from these lakes converge and the creek eventually flows into Owens Valley, at an altitude of 1300 meters. Southern California Edison has been diverting Bishop creek water for hydroelectric power for many years. Recently there has been concern as to the effects stream diversion has on the riparian community. Although there is a required minimum flow that must be released from the hydroelectric power plants to the channel, during certain times of the year it may be lower than natural flow would be. Decreased stream flow could lower the water table near the stream below the root zone of some plant species. Furthermore, reservoirs temper high flow periods that would otherwise recharge stream banks. The objective of this study is to determine those areas that gain ground water along diverted reaches. The results of this study will be integrated with other projects funded by Southern California Edison to better understand plant-water relationships and the possible plant stress that can occur due to man-made diversions. 1 2 Figure 1– Location map of Bishop Creek, CA. Presented at the California Riparian Systems Conference, September 22-24, 1988; Davis, California. Graduate Research Assistant and Research Professor, respectively, Desert Research Institute, Las Vegas, NV, and Dept. of Geosciences, University of Nevada, Las Vegas, NV; Assistant Professor, Dept. of Biology, University of Nevada, Las Vegas, NV. USDA Forest Service Gen. Tech. Rep. PSW-110. 1989. 349 Methods Results and Conclusions The stable isotopic ratios of hydrogen (D/H) and oxygen (18O/16O) are primarily used as conservative water tracers. They are used to determine residence times, mixing, and sources of waters. Deuterium and oxygen18 are conservative because they are a part of the water molecule. Their concentration in a particular water is dependent on isotope fractionation that occurs during phase changes (i.e. condensation and evaporation). This is due to differences in mass and energy between isotopes. As a result, the isotopic composition of various types of waters are unique. Variation of the isotopic composition in natural waters has been reviewed by Dansgaard (1964). Average δD lake values are -122 per mil, -121 per mil, and -120 per mil for May, July, and September, 1986, respectively. Average δ18O lake values are -16.3 per mil, -16.3 per mil, -16.0 per mil, for May, July, and September, 1986, respectively. Ground-water samples from wells and spring have average δD values of -133 per mil, -133 per mil, and -131 per mil, for May, July, and September, 1986, respectively. Average δ18O values are -17.2 per mil, -17.5 per mil, and -17.3 per mil for May, July, and September, 1986, respectively. Because ground water is not exposed to the fractionation effects from evaporation like lake waters, it has a significantly different δD and δ18O value. Therefore, stable isotope analysis can be used to delineate surface water from ground water. The values for D/H and 18O/16O ratios are produced using a mass spectrometer that compares the sample to a known standard: δ(per mil) = (Rsample/Rstandard — 1) x 1000 where for δ18O, R=18O/16O and for δD, R=D/H. The standard is V-SMOW (Vienna Standard Mean Ocean Water), which is nearly identical to SMOW as defined by Craig (1961). The standard deviation for δD and δ18O values are ±1 per mil and ±0.3 per mil respectively. Figure 2 shows the locations for surface and groundwater samples collected in 1986. Some sampling points were added and some dropped as deemed appropriate. Surface and ground-water samples were collected on May 28-30, July 21-23, and September 27-28, 1986. Virtually all surface flow into Bishop Creek originates from the three alpine reservoirs. Therefore, analysis of lake outflow provides an isotopic signature for surface water input to the creek. Ground-water sampling from available springs and wells provides an average δD and δ18O value for subsurface flow to the stream. Another condition that must be met to determine gaining reaches is that ground-water influx must be significant relative to stream flow, otherwise isotopic shifts cannot be detected. Outflow from the headwater lakes is much greater than ground-water influx. However, penstocks divert most of this water to be used for hydroelectric power. Thus, water that flows out of the Power Plants to the natural channel is much less, though it still reflects the isotopic signature of surface water. Figure 2- Location of sample sites at Bishop Creek. 350 USDA Forest Service Gen. Tech. Rep. PSW-110. 1989. Figure 3 shows the δD values of sample points for September 1986. Results for May and July did not show isotopic shifts due to high stream flow conditions from spring snow melt. This masked ground-water input for these sampling periods. However, by September stream flow decreased, and gaining reaches could be determined. Of primary concern are the reaches between each of the Power Plants. Figure 3 shows a δD shift from -120 per mil to -127 per mil between Power Plants 2 and 3. This shift is from an isotopic signature characteristic of surface water to that of ground water. Therefore, this is a gaining reach. The reach between Power Plants 3 and 4 has a significant influx from Coyote Creek that masks groundwater discharge. A sample just above the confluence with Coyote Creek was not taken in 1986 (as suggested by Figure 2). Samples were collected in 1987 and at this time tentatively suggest that the reach between Power Plant 3 and the confluence with Coyote Creek is gaining. Isotopic analysis on the two lower reaches does not clearly show an isotopic shift between the Power Plants. The δD values do not shift enough to be significant, since all the values are within measurement error. Field trips taken in 1987 revealed that the reach between Power Plants 4 and 5 was losing due to a playing out of stream flow into the alluvium along this stretch. The stream flowed all the way between Plants 5 and 6 but showed no significant isotopic shift. Whether this stretch is stable or losing is unknown because this method will not detect such reaches. Data from δ18O values showed similar results as those from the deuterium analyses. In conclusion, an isotopic analysis of Bishop Creek shows that the upper diverted reaches are gaining while at least one of the lower two reaches are losing. In the future, it may be possible to quantify the amount of ground water discharging into Bishop Creek using an isotopic-mass balance equation. It may also be possible to determine the water source(s) of vegetation using isotopes. At this time laboratory methods are being tested to determine how to extract tree water from wood samples without fractionation. The isotopic signature of the tree water should reflect one or more of the isotopic values of the various waters found in the watershed. These are surface water, ground water, and soil water. Knowledge of the water sources to vegetation will give a better understanding to the possible stresses that can occur to the riparian vegetation due to man-made diversions. USDA Forest Service Gen. Tech. Rep. PSW-110. 1989. Figure 3– Del δD values (per mil) for September 1986. References Craig, II. 1961. Isotopic variation in meteoric waters. Science 133(3465): 1702-1703. Dansgaard, W. 1964. Stable isotopes in precipitation. Tellus XVI 4: 436-468. 351


