Measuring the Impact of Urbanization on Scenic 1
advertisement
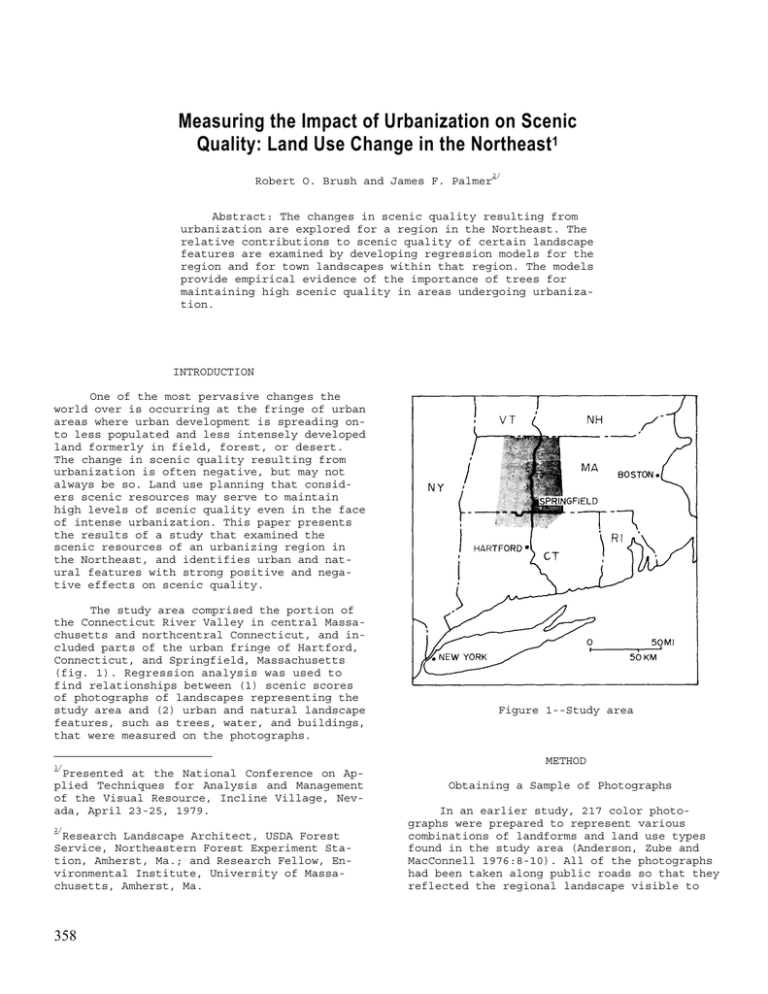
Measuring the Impact of Urbanization on Scenic Quality: Land Use Change in the Northeast 1 Robert O. Brush and James F. Palmer 2/ Abstract: The changes in scenic quality resulting from urbanization are explored for a region in the Northeast. The relative contributions to scenic quality of certain landscape features are examined by developing regression models for the region and for town landscapes within that region. The models provide empirical evidence of the importance of trees for maintaining high scenic quality in areas undergoing urbanization. INTRODUCTION One of the most pervasive changes the world over is occurring at the fringe of urban areas where urban development is spreading onto less populated and less intensely developed land formerly in field, forest, or desert. The change in scenic quality resulting from urbanization is often negative, but may not always be so. Land use planning that considers scenic resources may serve to maintain high levels of scenic quality even in the face of intense urbanization. This paper presents the results of a study that examined the scenic resources of an urbanizing region in the Northeast, and identifies urban and natural features with strong positive and negative effects on scenic quality. The study area comprised the portion of the Connecticut River Valley in central Massachusetts and northcentral Connecticut, and included parts of the urban fringe of Hartford, Connecticut, and Springfield, Massachusetts (fig. 1). Regression analysis was used to find relationships between (1) scenic scores of photographs of landscapes representing the study area and (2) urban and natural landscape features, such as trees, water, and buildings, that were measured on the photographs. 1/ Presented at the National Conference on Applied Techniques for Analysis and Management of the Visual Resource, Incline Village, Nevada, April 23-25, 1979. 2/ Research Landscape Architect, USDA Forest Service, Northeastern Forest Experiment Station, Amherst, Ma.; and Research Fellow, Environmental Institute, University of Massachusetts, Amherst, Ma. 358 Figure 1--Study area METHOD Obtaining a Sample of Photographs In an earlier study, 217 color photographs were prepared to represent various combinations of landforms and land use types found in the study area (Anderson, Zube and MacConnell 1976:8-10). All of the photographs had been taken along public roads so that they reflected the regional landscape visible to Figure 2--Farm, SRV = 6.0. Figure 3--Farm, SRV = 3.7. Figure 4--Meadow, SRV = 5.2. Figure 5--Meadow, SRV = 2.6. Figure 6--Forested hills, SRV = 5.4. Figure 7--Forested hills, SRV = 3.1. Figure 8--Open water, SRV = 6.5. 359 Figure 9--Open water, SRV = 4.4. Figure 10--Wetland, SRV = 5.7. Figure 11--Wetland, SRV = 5.0. Figure 12--Town, SRV = 5.3. Figure 13--Town, SRV = 1.2. Figure 14--Industry, SRV = 4.0. Figure 15--Industry, SRV = 1.9. 360 residents and travelers in the region. No attempt was made to frame the scenes with foreground vegetation or other foreground elements. Although the photographs were not composed for artistic merit, we found them to be characterized by an openness at the center of the view allowing the observer to see over the foreground and middleground. The space at the center of the scenes was usually enclosed by high landscape features in the hackground--hills, trees or buildings. Thus, what we term landscapes are not random views from a roadside, but instead are views of broad, enclosed spaces extending some distance away from the observer. Scenic resource values ranged from a low of 1.2 to a high of 6.5. The widest range in values was among the scenes classified as town landscapes. Most of the town scenes, however, had scenic resource values well below the overall mean of 3.6, as did all of the industrial landscape scenes. The scenic resource values of farm, wetland and open water landscapes were above the mean value, as were most of the forest and meadow landscapes (fig. 16). Because photographs can distort or misrepresent actual conditions, it is usually advisable to compare responses of people to photographed scenes with responses of people standing at the same site from which the photographs were taken. In this case we relied upon tests conducted in a previous study which found that similar responses were obtained for groups rating the photographs and groups rating the same scenes on-site (Zube, Pitt, and Anderson 1974:49). All of the 217 photographs in this large sample had been evaluated on scenic resource value by a group of 30 landscape architects and planners employed by universities, public agencies, or private offices within the study area (Anderson, Zube, and MacConnell 1976:7). Using the Q-sort procedure, each respondent sorted the 217 photographs into seven groups of fixed size approximating a normal distribution. Each class was assigned a value ranging from 1, for lowest scenic quality, to for highest scenic quality. The scores for each photograph were averaged, and we refer to the average score of a photograph as its scenic resource value. in addition, each of the photographs had been classified in one of seven landscape classes following principles of numerical taxonomy (Palmer 1978). All of the 18 persons making the classifications were residents of the study area. The seven landscape classes included farms, forested hills, meadows, open water, wetlands and streams, towns and industry. For this study we selected a sample of 124 photographs from the larger sample of 217. All 77 of the photographs in the larger sample, classified as either town or industry landscape classes, were used for this study. Another 47 photographs were selected at random from the remaining natural landscape classes-farm, forested hills, meadow, wetland and open water (figs. 2-15). Figure 16--Scenic resource value by landscape class Measuring Dependent Variables on the Photographs One of the advantages of using photographs to study how people perceive scenic quality is the ability to control what the respondents are viewing. Since the scenic quality ratings are based on information contained in the photograph, various landscape features were measured directly from the photographs. These landscape features became the independent variables in a regression model. Shafer, Hamilton and Schmidt (1969) found that combinations of landscape features in three distance zones, measured directly from photographs, explained 65 percent of the variation in scenic scores for a sample of 100 natural and wildland scenes in the United States. A similar procedure was followed in this study. Three distance zones were established: a near zone within which individual leaves of trees could be discerned; a middle zone in which the forms of trees could be discerned; and a far zone in which the shapes of trees could not be discerned. The area on the photograph of various landscape features within each of the three distance zones was measured with a planimeter in square inches. 361 The natural features measured were the area of trees, exposed ground and low vegetation (grass, meadow or pasture) in each of the three distance zones; the area of water over all distance zones; and the area of sky. The urban features measured were the area of buildings in each of three distance zones; the area of signs in near and middle zones, and the area of paving and signs over all distance zones. In addition, the length of wire between utility poles was measured in inches, and the number of utility poles in view was recorded. Analysis We developed two models by regressing the scenic resource value of a photograph on the quantity of landscape features measured on the photographs. The regional landscape model was based on 124 photographs of seven landscape classes in the portion of the Connecticut River Valley under study. The other model was based on 67 of the town landscapes from the larger sample. Before running the model we checked for high correlation between independent variables and found none of the pairwise correlations to be excessive, that is, over 0.7. We avoided a possible problem of multicollinearity by dropping the area measure of sky from the entire sample. Since the sum of the area variables measured in a photograph equaled a constant value, the last area variable entering the model could have been highly correlated with the sum of the other area variables. The regional model accounted for 63 percent of the variation in scenic resource value. In order to determine how much variation was explained by distance zones alone, we ran a regression on the same landscape feature summed across the three distance zones. Without the distance zones, the model accounted for 53 percent of the variation in scenic resource value among the 124 photographs, or 10 percent less. The same 18 variables in the town landscape model accounted for 68 percent of the variation in scenic resource value. The standardized regression coefficients for the regional model of all landscape classes in the study area appear in Table 1. Seven variables had a significant and positive effect on scenic resource value in all landscape classes throughout the region--trees in all three zones, low vegetation in the near and far zones, water surface area and buildings in the far zone. Three variables had a 362 significant and negative effect--length of utility wires, utility poles and exposed ground in the far zone. The large sample of town landscapes (n = 67) and the wide range of scenic resource values (1.17 to 5.40) allowed us to run a separate regression model to study the relative contribution to scenic quality of natural and urban landscape features in a town setting. Of the 18 measured variables, 6 were significant with positive signs--trees in the middle and far zones, low vegetation in the near and middle zones, exposed rock or ground in the far zone and buildings in the middle zone. Table 1 also lists the percentage of the photo sample in which a variable was measured. None of the variables covered more than 60 percent of any photograph. DISCUSSION Looking more closely at each model, we find that the standardized regression coefficients reveal the relative effect of particular landscape features on scenic resource value, holding all other variables constant. The advantage of reporting standardized regression coefficients is that they are independent of the scales used to measure the variables. If one coefficient is twice as large as another, then that variable is approximately twice as important in explaining scenic resource value. The real value of models such as these is in the insights they provide about the relative contribution of certain landscape features to scenic scores. In the regional model we find that natural landscape features have a positive effect on scenic resource value, and that most urban features have a negative effect. The variables that best explain the model are those that are statistically significant. We selected 0.05 as the level of probability for significance. In the regional model there were nine significant variables. Trees, in all three distance zones, and water had large positive coefficients. Low vegetation in the distant zone had a large positive coefficient. The area of buildings in the distant zone also had a positive coefficient. Therefore, photographs containing large amounts of these variables will have high scenic scores. Utility poles in the regional model had a high negative coefficient; exposed ground in the middle zone and wire also had negative coefficients. Photographs containing large amounts of these landscape features are likely to have low scenic resource value. Table 1--Standardized regression coefficients and frequency of photo-measured variables. Regional landscape model Landscape feature Trees Low vegetation (grass, meadow pasture) Distance Standardized zone regression coefficient Near .23* 26 Middle .37* Far .26* Near Middle Far Water All Exposed rock or soil Near Middle Far Building Near Middle Far Paving All Wire All Utility poles Signs Percent frequency in photo sample (n = 124) All Near Middle ns = not significant * = P < 0.05 .18 Town landscape model Standardized Percent frequency regression in photo sample coefficient (n = 67) ns 25 76 .19 .93* 91 85 .33* 76 ns 25 .35* 22 ns 83 .69* 88 11 ns 4 .17 .14* .04 ns 1 ns 12 ns .37* 16 ns 12 .06 64 .05 .27* 78 ns 4 .09 -.17* .07 .01 ns ns ns .09 .19* ns -.08 -.15* -.27* -.04 -.03 12 2 62 27 64 44 65 ns 2 ns 30 -.15 .17 .47* 28 ns 94 ns 60 ns 85 .36 -.04 92 ns .13 -.08 9 -.04 .00 ns 3 49 In the town landscape model there were six significant variables, all with positive coefficients: trees in the middle and far zones, low vegetation in the near and middle zones, exposed ground in the far zone and buildings in the middle zone. middle zone buildings and scenic resource value was slightly positive. This may reflect the influence of old and substantial homes in some of the photographs, or it may mean that buildings, primarily residences, are accepted features of town landscapes. By far the most influential variable in the town model was trees in the middle zone with a coefficient of 0.93. It is not clear what it is about trees that explains their strong positive effect on scenic quality in town landscapes. Perhaps the tall vertical masses of foliage rising above houses screen out utility poles, paving and buildings that lie beyond. Perhaps the trees symbolize the pastoral landscapes that suburbanites are seeking. Whatever the reason, the effect of trees is positive and pronounced in town landscapes. The regional and town landscape models were not meant to be used to predict scenic quality. The models were developed to study the relationship of certain landscape features to scenic quality. The findings of this research lend support to the belief that trees are an important scenic resource, particularly in areas undergoing urbanization. The positive effect of buildings in the middle zone of town landscapes is an interesting one. Even the correlation coefficient of In reviewing the process by which land is converted to suburbs in this country, Clawson (1971:50) noted that urban uses nearly always dominate over agricultural uses, and almost always dominate over forestry and grazing uses. Although the process of suburbanization of land may be inevitable, deterioration of scenic quality may not necessarily follow. 363 From our study in the Northeast we find that the presence of trees in town landscapes is the single most important landscape feature affecting scenic resource value. To the extent that trees and woodlands are retained during suburban land development, and to the extent that street trees are planted and open space is reserved, the scenic quality of town landscapes can remain high, as high as it might have been before as farmland or wildland. LITERATURE CITED Anderson, Thomas W., Ervin H. Zube, and William P. MacConnell 1976. In Studies in Landscape Perception. Ervin H Zube,(ed.), p. 6-69. Publ. No. R-76-1, Institute for Man and Environment, Univ. Mass., Amherst. Clawson, Marion 1971. Suburban Land Conversion in the United States. 406 p. The Johns Hopkins Press, for Resources for the Future, Inc., Baltimore, Md. Palmer, James F. 1978. An investigation of the conceptual classification of landscapes and its application to landscape planning issues. In Priorities for Environmental Design Research, Part I. Sue Weidemann and James R. Anderson, (eds.) p. 92-103. Environmental Design Research Assoc., Washington, D.C. Shafer, Elwood L. Jr., John P. Hamilton, Jr., and Elizabeth A. Schmidt 1969. Natural landscape preferences: a predictive model. J. Leisure Res. 1(1):1-19. Zube, Ervin H., David G. Pitt, and Thomas W. Anderson 1974. Perception and Measurement of Scenic Resources in the Connecticut River Valley. Publ. No. R-74-1, 191 p. Institute for Man and Environment, Univ. Mass., Amherst. 364
