Structure Ignition Assessment Model (SIAM)
advertisement
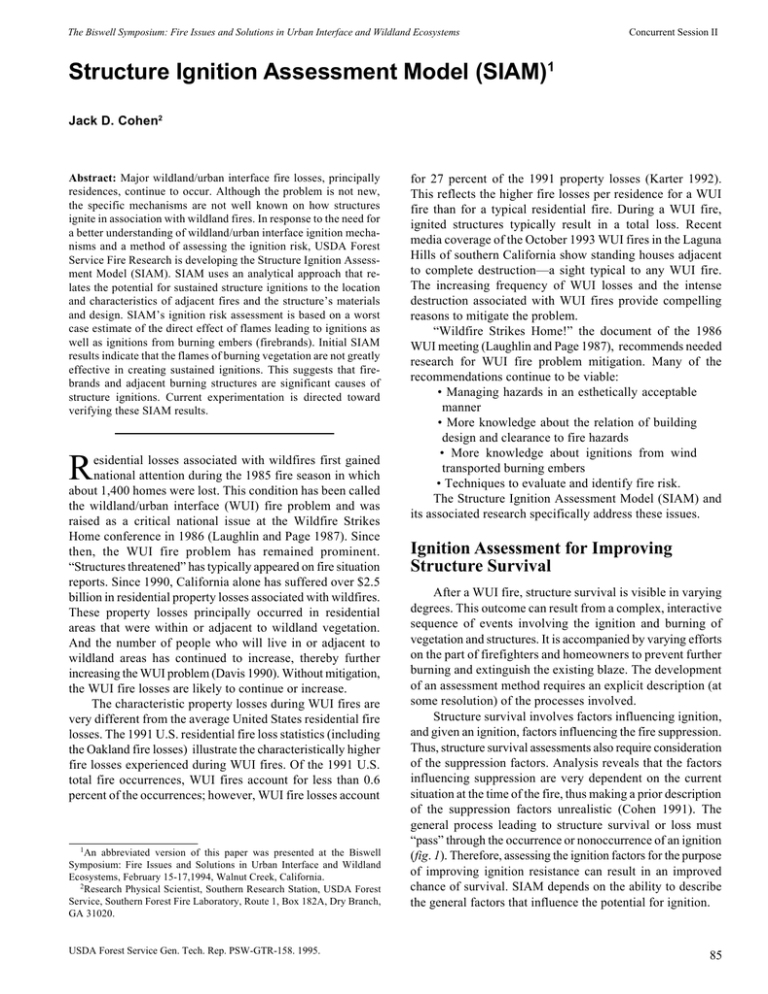
The Biswell Symposium: Fire Issues and Solutions in Urban Interface and Wildland Ecosystems Concurrent Session II Structure Ignition Assessment Model (SIAM)1 Jack D. Cohen2 Abstract: Major wildland/urban interface fire losses, principally residences, continue to occur. Although the problem is not new, the specific mechanisms are not well known on how structures ignite in association with wildland fires. In response to the need for a better understanding of wildland/urban interface ignition mechanisms and a method of assessing the ignition risk, USDA Forest Service Fire Research is developing the Structure Ignition Assessment Model (SIAM). SIAM uses an analytical approach that relates the potential for sustained structure ignitions to the location and characteristics of adjacent fires and the structure’s materials and design. SIAM’s ignition risk assessment is based on a worst case estimate of the direct effect of flames leading to ignitions as well as ignitions from burning embers (firebrands). Initial SIAM results indicate that the flames of burning vegetation are not greatly effective in creating sustained ignitions. This suggests that firebrands and adjacent burning structures are significant causes of structure ignitions. Current experimentation is directed toward verifying these SIAM results. R esidential losses associated with wildfires first gained national attention during the 1985 fire season in which about 1,400 homes were lost. This condition has been called the wildland/urban interface (WUI) fire problem and was raised as a critical national issue at the Wildfire Strikes Home conference in 1986 (Laughlin and Page 1987). Since then, the WUI fire problem has remained prominent. “Structures threatened” has typically appeared on fire situation reports. Since 1990, California alone has suffered over $2.5 billion in residential property losses associated with wildfires. These property losses principally occurred in residential areas that were within or adjacent to wildland vegetation. And the number of people who will live in or adjacent to wildland areas has continued to increase, thereby further increasing the WUI problem (Davis 1990). Without mitigation, the WUI fire losses are likely to continue or increase. The characteristic property losses during WUI fires are very different from the average United States residential fire losses. The 1991 U.S. residential fire loss statistics (including the Oakland fire losses) illustrate the characteristically higher fire losses experienced during WUI fires. Of the 1991 U.S. total fire occurrences, WUI fires account for less than 0.6 percent of the occurrences; however, WUI fire losses account 1An abbreviated version of this paper was presented at the Biswell Symposium: Fire Issues and Solutions in Urban Interface and Wildland Ecosystems, February 15-17,1994, Walnut Creek, California. 2Research Physical Scientist, Southern Research Station, USDA Forest Service, Southern Forest Fire Laboratory, Route 1, Box 182A, Dry Branch, GA 31020. USDA Forest Service Gen. Tech. Rep. PSW-GTR-158. 1995. for 27 percent of the 1991 property losses (Karter 1992). This reflects the higher fire losses per residence for a WUI fire than for a typical residential fire. During a WUI fire, ignited structures typically result in a total loss. Recent media coverage of the October 1993 WUI fires in the Laguna Hills of southern California show standing houses adjacent to complete destruction—a sight typical to any WUI fire. The increasing frequency of WUI losses and the intense destruction associated with WUI fires provide compelling reasons to mitigate the problem. “Wildfire Strikes Home!” the document of the 1986 WUI meeting (Laughlin and Page 1987), recommends needed research for WUI fire problem mitigation. Many of the recommendations continue to be viable: • Managing hazards in an esthetically acceptable manner • More knowledge about the relation of building design and clearance to fire hazards • More knowledge about ignitions from wind transported burning embers • Techniques to evaluate and identify fire risk. The Structure Ignition Assessment Model (SIAM) and its associated research specifically address these issues. Ignition Assessment for Improving Structure Survival After a WUI fire, structure survival is visible in varying degrees. This outcome can result from a complex, interactive sequence of events involving the ignition and burning of vegetation and structures. It is accompanied by varying efforts on the part of firefighters and homeowners to prevent further burning and extinguish the existing blaze. The development of an assessment method requires an explicit description (at some resolution) of the processes involved. Structure survival involves factors influencing ignition, and given an ignition, factors influencing the fire suppression. Thus, structure survival assessments also require consideration of the suppression factors. Analysis reveals that the factors influencing suppression are very dependent on the current situation at the time of the fire, thus making a prior description of the suppression factors unrealistic (Cohen 1991). The general process leading to structure survival or loss must “pass” through the occurrence or nonoccurrence of an ignition (fig. 1). Therefore, assessing the ignition factors for the purpose of improving ignition resistance can result in an improved chance of survival. SIAM depends on the ability to describe the general factors that influence the potential for ignition. 85 The Biswell Symposium: Fire Issues and Solutions in Urban Interface and Wildland Ecosystems The WUI fire problem can be examined on the premise that structure survival is the essence of the problem, and that structure ignition is the critical element for survival: homes that do not ignite do not burn. SIAM addresses the potential for structure ignitions rather than the potential for structure survival. The Structure Ignition Assessment Model (SIAM) SIAM is designed for the purpose of assessing potential structure ignitions during wildfires burning in vegetation and structures. The model uses general descriptions of the structure, the topography at the building site, and the potential fire characteristics around the structure to compute an index of ignition risk. It is designed to provide a flexible approach toward achieving residential fire safety by rating the potential for ignitions based on a structure’s ignition resistance characteristics and its potential fire exposure. Thus, homeowners and developers can “trade off” various design features of a building’s exterior and its surroundings to meet fire-safe requirements. SIAM is intended for the facilitation of improved fire safety as well as to identify potential wildland/urban interface fire problems. In its basic form, the model can be adapted to a variety of applications ranging from single home assessments to planned developments. The basic applications can include: • Establishment of fire safety requirements based on potential ignition risk for a mix of factors. • Integration of a resident’s exterior home design and landscaping interests with fire safety requirements. • Integration of a developer’s home and neighborhood design interests with fire safety requirements. Figure 1—Structure survival depends on factors influencing ignition and factors influencing effective fire suppression. Regardless of the fire suppression effectiveness, survival initially depends on ignition. 86 Concurrent Session II • Ability of fire agencies to assess wildland/urban interface fire risks for pre-suppression and suppression planning. To achieve these applications, SIAM uses an analytical approach to establish relationships between the structure design and the fire exposure that results in the assessment of potential ignitions. Because actual fire conditions of a future fire are unknown, worst-case assumptions are used. For example, it is not known how and in what sequence the flammables around a structure will burn; therefore, it is assumed that all flammables adjacent to the structure will burn at the same time. If conditions are not well understood, e.g., firebrand (flying embers) exposure and ignition, judgments based on physical reasoning are used. Because of the various unknowns, SIAM rates only the potential for structure ignition; it does not predict ignition. A better understanding of the model’s processes can be obtained by examining the components of SIAM from the input of information to the output of the resulting ignition risk rating (fig. 2). The SIAM model consists of six principal processing steps (items in the brackets refer to fig. 2): 1) [Structure Design, Topography, Fire Weather Severity, Fuels, Expert Designated Fire Behavior] SIAM inputs require the description of the structure and site conditions, including a fire professional’s estimate of flame lengths that are consistent with the chosen potential severe fire weather conditions. The Structure Design inputs relate to the general design, e.g., roof flammability, exterior materials, windows, nooks and crannies, and exterior dimensions. The Topography input refers to the degree of slope and whether it is upslope or downslope from the structure. Also included is the structure/slope set-back, i.e., the horizontal distance between the structure and the slope. The Fire Weather Severity is a selected level of weather conditions for planning WUI fire safety. The inputs explicitly involve windspeed, Figure 2—The Structure Ignition Assessment Model (SIAM) uses the inputs (double line boxes) to calculate the potential for ignitions from direct flame exposure (Heat Transfer) and exposure to aerially transported burning embers (Firebrands). SIAM produces a dimensionless ignition risk rating index, not a prediction of outcomes. USDA Forest Service Gen. Tech. Rep. PSW-GTR-158. 1995. The Biswell Symposium: Fire Issues and Solutions in Urban Interface and Wildland Ecosystems temperature, and fine fuel moisture content. Implicitly, the Fire Weather Severity guides the user in designating, and/or calculating, the fire behavior characteristics. The Fuels inputs require the designation of the type of flammable material (e.g., grass, shrubs, trees, wood piles, structures), the dimensions of its area, and its distance from the structure. The Expert Designated Fire Behavior includes flame length and rate of spread if appropriate. These fire behavior inputs can be calculated through the BEHAVE Fire Behavior Prediction System (Andrews 1986, Andrews and Chase 1989) and/or estimated experientially. 2) [Flames] On the basis of input information of the fuel type, the fuel locations and the fuel length/width dimensions, windspeed, topographic slope, and flame lengths, SIAM calculates flame size, flame angle, burning residence time, and the structure’s exposure to flame radiant heating and flame or convection column contact. 3) [Heat transfer] SIAM uses a physical heat transfer model to relate the calculated flame characteristics to the radiative and convective heat transfer. Worst-case assumptions are used for such items as the flame temperature and the flame/wall geometry. 4) [Firebrands] The firebrand exposure depends on the amount and size distribution of the firebrands generated. Using physical reasoning and experience, a structure’s firebrand exposure corresponds to the type of fuel in the wildland/urban interface area and the general fire intensity. The type of fuel (e.g., grass, shrubs, trees, buildings) relates to the general size of the firebrand, while the fire intensity relates to the fire’s lofting capability. 5) [Ignitions] An empirical ignition model (Tran and others 1992) is used to relate heat transfer to the potential for sustained ignitions of wood. The assessment of the potential for ignition on exterior wood building materials depends on the magnitude of the heat transfer, and the burning time. Using physical reasoning, the potential for ignition by firebrands is subjectively related to the firebrand exposure and the structure’s exposed flammable nooks and crannies and roof material. SIAM calculates the influence of firebrands on the ignition potential separately from the direct flame heat transfer influence. 6) [Ignition risk rating] The assessments for ignition potential from direct flame heat transfer and firebrand exposure are subjectively combined for the entire structure. The final risk rating recognizes the potential interactions between structure heating (without ignitions from flame heat transfer) and firebrand ignition effectiveness. The final rating is a dimensionless quantity, linearly related to potential structure ignition (Cohen and others 1991). An important procedural change has occurred with regard to the determination of the fire behavior characteristics. Fire behavior characteristics such as flame length and rate of USDA Forest Service Gen. Tech. Rep. PSW-GTR-158. 1995. Concurrent Session II spread are not calculated by SIAM—they are now direct inputs. Through personal expertise and/or fire behavior modeling, the user determines the fire behavior that matches previously chosen fire severity conditions. This change has occurred because the application is largely out of context for available operational fire models. The intent is to produce greater model reliability by involving the user in the determination of the fire behavior characteristics. Experiments in Support of Ignition Assessment Modeling Several aspects of ignition require a better understanding before SIAM can reliably rate ignition risk. These issues are being approached through experimental methods. Currently, an experimental examination is being done to better understand the effect of windows (principally window breakage) on potential ignitions. In conjunction with the window experiments, the flame radiation heat transfer model and the ignition model are being examined for their reliability. The experimental work is not complete, but preliminary results suggest some important considerations. Window Breakage Tests Windows often fracture when exposed to a nearby exterior fire. The structural fire problem regarding windows involves the fracture and subsequent collapse, in which an opening is created. In the wildland/urban interface context, firebrands are a very important structure ignition source. Experience indicates that any opening to the interior of the structure increases the potential for ignition. In the context of SIAM, windows are an important factor principally if a fire exposure results in a window fracture and collapse, but without a concurrent exterior ignition, because the only effect of the fire exposure is to create an opening, and thus an entry point for firebrands. The experiments are designed to address the question of window collapse specific to SIAM needs. The window breakage experiments have been conducted in two phases. The first phase uses relatively small windows exposed to relatively low heat fluxes (heat flux = energy/ time/area). The window pane dimensions measure .61 meters by .61 meters by 4.8 millimeters thick. A wooden sash holds the glass panes in a wooden frame. Tests are conducted on both plate and tempered glass types, and in single pane and double pane arrangements. The window heat exposures consist of average total heat fluxes of 9.3 kW/sq m, 13.6 kW/sq m, and 17.7 kW/sq m for 300 seconds (kW/sq m = kilowatts per square meter). The experiments use the USDA Forest Service’s Southern Forest Fire Laboratory’s wind tunnel facility and a propane fueled flame source. Phase 1 has been completed. Preliminary results indicate significant differences between plate and tempered glass, and the potential integrity of double pane windows compared with single pane arrangements (table 1). The results show that for every test of single pane/plate glass, window breakage 87 The Biswell Symposium: Fire Issues and Solutions in Urban Interface and Wildland Ecosystems Table 1—Phase 1 window breakage results Heat flux (kW/m2) Glass type and arrangement 9.3 13.6 17.7 4/41 4/4 4/4 4/4 0/4 4/4 3/4 4/4 3/4 0/4 0/4 0/4 0/4 0/4 0/4 0/4 0/4 0/4 Plate glass: Single pane Double pane Outer pane Inner pane Tempered glass: Single pane Double pane Outer pane Inner pane 1 Number of tests in which window pane broke per number of tests. resulted at each heat flux, yielding a ratio of 4/4. For double pane/plate glass at the lowest heat flux, 9.3 kW/sq m, only the outside pane broke in each test (4/4; and 0/4). The higher heat fluxes resulted in inside pane breakage in 3 of 4 tests. However, from observation during the experiments, the degree of fracture to the inside pane, i.e., the number of cracks, was less than for the outside pane. No breakage occurred to tempered glass panes due to the fire exposures. Although all heat fluxes resulted in plate glass breakage, none of the windows collapsed leaving an opening. In each case, the wooden sash held the glass fragments sufficiently to prevent collapse. This raised the important question if larger windows and higher heat fluxes of shorter duration would result in collapse. Phase 2 of the study used larger windows and higher heat fluxes. The panes were plate glass, measuring .91 meters wide by 1.5 meters tall, and 6 millimeters thick. The panes were held in a wood frame by a wood sash that was part of a wall section 2.5 meters tall by 3.4 meters wide. Exterior plywood siding (T-111, unpainted) covered the wall during the glass breakage experiments. The tests were conducted in the USDA Forest Service’s Southern Forest Fire Laboratory’s combustion facility using precisely constructed, oven-dried wood fuel cribs. The entire crib was simultaneously ignited, resulting in maximum flame dimensions of about 1.3 meters wide, 3.1 meters high, and .8 meters deep. Because heat flux sensors could not be placed at the glass surface, calibration measurements determined the window heat fluxes instead of real time measurements. The heat flux sensors were located in a non-flammable panel that was placed in the window opening. The calibration measurements generally covered the area of highest total heat flux for the wall section. The average highest total heat fluxes were measured during calibration tests performed at two different intensity levels (fig. 3). These intensity levels correspond to the different flame-to-wall distances noted in the figure. The highest intensity level exceeded 50 kW/sq m 88 Concurrent Session II at its peak burning period, compared to 30 kW/sq m for the lower intensity profile. Although the Phase 2 testing has just begun, significant results have already been observed. The 50 kW/sq m heat flux tests resulted in glass breakage and virtually complete window collapse. Immediately following the window collapse, wall ignition occurred followed by sustained burning. The 30 kW/sq m heat flux test also resulted in glass breakage and virtually complete window collapse, but without wall ignition. Thus, these initial experiments showed that windows can be a significant factor for potential structure ignitions, by allowing interior firebrand penetration without the occurrence of an exterior structure ignition. Continued window experimentation will better define the differences in window collapse between the Phase 1 and Phase 2 experiments and extend the range of test conditions beyond Phase 1. Questions remain as to whether the large windows will break without collapse, to what extent a double pane arrangement mitigates window collapse, and whether tempered glass in either a single pane or double pane arrangement will prevent window collapse until exterior ignitions occur. Wall Ignition Tests It is important to verify that SIAM is consistent with real situations. An initial step in this verification process is to measure total heat flux and observe ignition occurrence at the wall section concurrent to the window breakage tests. By comparing measured observations with model results, these experiments provide a physical test under high heat flux conditions with relatively large flames, and with a heat flux/ time relationship similiar to actual vegetation burning (fig. 3). Ignition observations can be compared with the ignition model (Tran and others 1992). Ignition model calculations using heat flux calibration data provide an estimate of sustained ignition occurrence (sustained ignition = continued flaming after the initiating heat source is discontinued). Figures 4, 5, and 6 show the heat fluxes with the flux-time ignition calculation superimposed (right axis values). The horizontal line delineates the flux-time value that corresponds to the piloted ignition point (piloted ignition = the presence of a hot spark or small flame that initiates flaming). Inspection of figure 4 indicates that the flux-time exposure (65 cm distance) should readily result in an ignition. This can be seen by comparing the flux-time curve with the piloted ignition value. The lower heat flux shown in figure 5 (100 cm distance) results in a much lower flux-time magnitude and indicates a marginal condition for ignition. The actual tests produced results consistent with the ignition model calculations. At the higher heat flux (65 cm distance), the wood siding readily ignited with sustained flaming. The lower heat flux test (100 cm distance) did not result in ignition. Figure 6 illustrates the average total heat flux at a location adjacent to the glass pane in the wood window frame. At this location, the flux-time calculation USDA Forest Service Gen. Tech. Rep. PSW-GTR-158. 1995. The Biswell Symposium: Fire Issues and Solutions in Urban Interface and Wildland Ecosystems Concurrent Session II Figure 3—Total incident heat flux and flame distance comparison for the 65-cm and 100-cm calibrations from the Phase 2 portion of SIAM experimentation. Calibration tests such as these indirectly determine the window heat flux exposure. does not reach the ignition point, which is consistent with the no-ignition occurrence. Preliminary SIAM Results Although SIAM is not ready for operational assessments, the component models for heat transfer and ignition can be used. Thus, given constant flame characteristics and distances, estimates of the time required for ignition can be calculated. Preliminary SIAM results can be examined for flame descriptions relevant to burning vegetation and burning structures. The ignition model (Tran and others 1992) uses incident radiant heat flux (not the net heat flux) to calculate an ignition time. For a given constant heat flux, the ignition model provides a relationship between radiant heat flux and the amount of time for the piloted, sustained ignition of wood (fig. 7). At heat fluxes below 30 kW/sq m, the heat flux/ignition time relation has a high rate of change; therefore, small changes in heat flux can result in large changes to ignition time. Considering that vegetation fuels (without a continuous bed of large stem wood) have flaming residence times generally less than 120 seconds, a small change in heat flux can make the difference between an ignition and no ignition. Also, people are more sensitive than wood to the radiant heat fluxes: at 16 kW/sq m, skin blisters form after 5 seconds (Drysdale 1985), but wood takes 1,200 seconds before piloted ignition. Because actual fire conditions are not predictable, SIAM calculates the radiation heat transfer for a worst-case situation. The flame is assumed to be a constant, 1,200 degrees Kelvin, gray body emitter over its entire dimensions. And, the radiation view from the wall to the flame is assumed to be that of two parallel surfaces with their centers aligned. Based on these USDA Forest Service Gen. Tech. Rep. PSW-GTR-158. 1995. assumptions and given flame dimensions, a relationship exists between the radiant heat flux and the flame-to-wall distance (fig. 8). The given flame dimensions represent possible vegetation fire conditions (e.g., 5 m wide by 2 m high flame = a low flammable hedge row; 5 m wide by 15 m high flame = a fully torching tree). SIAM uses the heat fluxes to calculate the potential for ignition. The ignition times (fig. 9) for a flat wood surface are associated with the heat fluxes of figure 8. The ignition time graph shows the minimum time for ignition related to the flame-to-wall distance for the given flame dimensions. The graph is limited to 300 seconds because the burning time of the flame front in vegetation fires is generally less than 5 minutes. Note that with the exception of the two largest flame sizes, the flames have virtually no direct significance beyond 10 meters (33 feet). These preliminary results suggest that vegetation management activities are most effective in the areas immediately surrounding the structure. However, vegetation is not the only potential flame source adjacent to a residence. The neighbor’s house may also be a fire threat. Local agencies often focus on flammable vegetation as a factor in wildland/urban interface fire safety concerns. However, depending on the distance between residences (structure density), neighboring structures can be a very significant ignition source. The radiant heat flux is a function of distance between structures and structure size (worst-case conditions are assumed) (fig. 10). The calculations assume that the entire wall is burning and that the flame is a rectangular, black body emitter at a constant temperature of 1,200 degrees Kelvin. The walls are assumed to be parallel with their centers aligned. Importantly, larger structures produce higher heat fluxes, and thus if burning, larger structures are a greater threat to neighboring structures (fig. 10). 89 The Biswell Symposium: Fire Issues and Solutions in Urban Interface and Wildland Ecosystems Concurrent Session II Figure 4—Fire test calibration for the 65-cm flame to wall distance. The flux-time value (right axis reference) is a cumulative quantity that empirically relates to piloted, sustained wood ignition (Tran and others 1992). The flux-time value begins to increase above the critical incident radiant heat flux (greater than 13.1 kW/sq m) and ceases when the heat flux falls below the critical flux. Ignition is expected at a flux-time value of 11,501, which corresponds to the ignition line. The heavy, S-shaped curve is the flux-time curve. Figure 5—Fire test calibration for the 100-cm flame to wall distance. The flux-time value (right axis reference) is a cumulative quantity that empirically relates to piloted, sustained wood ignition (Tran and others 1992). The flux-time value begins to increase above the critical incident radiant heat flux (greater than 13.1 kW/sq m) and ceases when the heat flux falls below the critical flux. Ignition is expected at a flux-time value of 11,501, which corresponds to the ignition line. The heavy, S-shaped curve is the flux-time curve. Figure 6—Wall fire test without ignition for the 100 cm flame to wall distance. The flux-time curve (right axis reference) is based on measured heat fluxes of the wood wall panel adjacent to the window. The maximum flux-time quantity did not achieve a value equal to or greater than the critical ignition level. Figure 7—Minimum ignition time vs. radiant heat flux. Given a constant radiant heat flux, the ignition model (SIAM) can be used to estimate the time required for sustained ignition on a flat wood surface. The references to pain and blistering relate to exposed skin at the given radiant heat fluxes. Figure 11 provides the minimum ignition times based on the heat fluxes shown in figure 10. The graph extends to greater ignition times because structures characteristically burn longer than vegetation. Inspection of the ignition times suggests that the clearance between structures should be about 8 meters (26 feet) for the one-story structure and about 12 meters (39 feet) for the two-story structure. Although these examples are hypothetical, past wildland/urban interface fires involving high-density residential neighborhoods (e.g., Oakland, 1991) indicate the importance of structure-to-structure ignition. 90 USDA Forest Service Gen. Tech. Rep. PSW-GTR-158. 1995. The Biswell Symposium: Fire Issues and Solutions in Urban Interface and Wildland Ecosystems Concurrent Session II Figure 8—Radiant heat flux vs. distance for burning vegetation. The amount of radiant heat flux and the rate of decrease depends on the flame size. The distance refers to the distance from the flame. Based on these heat fluxes, ignition times are calculated as a function of distance. As the distance increases, it takes longer for sustained ignition to occur. Figure 9—Ignition time vs. distance for burning vegetation. The amount of radiant heat flux and the rate of decrease depends on the flame size. The distance refers to the distance from the flame. Based on these heat fluxes, ignition times are calculated as a function of distance. As the distance increases, it takes longer for sustained ignition to occur. Figure 10—Radiant heat flux vs. distance for an adjacent burning structure. The amount of radiant heat flux and the rate of decrease depends on the flame size. The distance refers to the distance from the flame. Based on these heat fluxes, ignition times are calculated as a function of distance. As the distance increases, it takes longer for sustained ignition to occur. Figure 11—Ignition time vs. distance for an adjacent burning structure. The amount of radiant heat flux and the rate of decrease depends on the flame size. The distance refers to the distance from the flame. Based on these heat fluxes, ignition times are calculated as a function of distance. As the distance increases, it takes longer for sustained ignition to occur. The radiant heat flux from structures is not necessarily greater than from vegetation, but the characteristic burning time is longer; thus the ignition time axis covers a greater range for burning structures. Conclusions The Structure Ignition Assessment Model is being developed as a tool for the purpose of reducing high residential fire losses associated with wildland fires. In the context of wildland/urban interface fires, SIAM rates the potential for USDA Forest Service Gen. Tech. Rep. PSW-GTR-158. 1995. structure ignitions rather than predicts structure ignitions. SIAM does not address structure survival, but assumes that lowering a structure’s ignition risk leads to improved chances for survival. SIAM development involves experimental work to gain needed understanding and to verify the reliability of SIAM’s component models. Current experiments involve determining 91 The Biswell Symposium: Fire Issues and Solutions in Urban Interface and Wildland Ecosystems the significance of windows regarding the potential for structure ignition. Concurrently, these experiments are an initial effort to verify the reliability of SIAM’s heat transfer and ignition models. The experimental work is not complete, but it has generated preliminary results regarding the behavior of heated windows and the verification of the ignition model. Preliminary results of the Phase 1 window experiments produced significant differences between glass types and pane arrangement. These results suggest that for an exterior fire exposure, the double pane arrangement improves window integrity, and significantly, tempered glass is much more thermally resistant than plate glass. The Phase 2 experiments (not completed) have demonstrated that windows can break and collapse from fire exposure without the occurrence of an exterior structure ignition. This finding has determined that SIAM requires window information in the description of significant design features that contribute to structure ignitions during wildland/ urban interface fires. Although model verification is just beginning, the observations from the accomplished tests suggest that the preliminary SIAM results are reasonable. The 35-cm fire-towall distance change (for the specific fire dimensions) results in the difference between wall ignition versus no ignition. Analysis of the measured heat flux data using the ignition model produces results consistent with the observed ignition occurrence. This suggests that the SIAM ignition model reasonably represents the relationship between incident radiant heat flux and ignition. Preliminary SIAM results suggest that ignitions from flames (radiant and convective heat transfer) occur from fires within the immediate surroundings of the structure. Except for the case of large flame heights and an extensive fireline, ignitions result from flames within 15 meters (50 feet) of the structure (fig. 9). But, ignitions on structures and adjacent vegetation commonly occur while fires burn at distances considerably greater than 15 meters. This finding concurs with personal observations that firebrands are a significant source for structure ignitions. These results suggest that to reduce ignitions, the distances from a structure for managing vegetation are much smaller than the lofting distances for firebrands. Thus, beyond some relatively short distance from the structure (depending on the vegetation and topography), vegetation management has no significant benefit for reducing flame generated ignitions. Vegetation management, on the other hand, cannot be extensive enough, in a practical sense, to significantly reduce firebrand ignitions. Therefore, the structure and its immediate surroundings should be the focus for activities intended for improving ignition risk. 92 Concurrent Session II Neighboring structures are a significant potential ignition source. SIAM results suggest that at distances between structures of less than 5 meters, structures can become the principal source for ignitions (not including the additional effect of firebrands from structures). In high-density residential areas containing highly flammable structures (e.g., residences with flammable roofs), vegetation management may not be sufficient to prevent widespread fire destruction. References Andrews, Patricia L. 1986. BEHAVE: fire behavior prediction and fuel modeling system—BURN subsystem, part 1. Gen. Tech. Rep. INTGTR-94. Ogden, UT: Intermountain Research Station, Forest Service, U.S. Department of Agriculture; 130 p. Andrews, Patricia L.; Chase, Carolyn H. 1989. BEHAVE: fire behavior prediction and fuel modeling system—BURN subsystem, part 2. Gen. Tech. Rep. INT-GTR-260. Ogden, UT: Intermountain Research Station, Forest Service, U.S. Department of Agriculture; 93 p. Cohen, Jack D. 1991. A site-specific approach for assessing the fire risk to structures at the wildland/urban interface. In: Nodvin, Stephen C.; Waldrop, Thomas A., editors. Proceedings of the fire and the environment: ecological and cultural perspectives international symposium; 1990 March 20-24; Knoxville, TN. Gen. Tech. Rep. SEGTR-69. Asheville, NC: Southeastern Experiment Station, Forest Service, U.S. Department of Agriculture; 381-383. Cohen, Jack D.; Chase, Richard A.; LeVan, Susan L.; Tran, Hao C. 1991. A model for assessing potential structure ignitions in the wildland/ urban interface. In: Proceedings of the 11th conference on fire and forest meteorology; 1991 April 16-19; Missoula, MT. Bethesda, MD: Soc. of Am. Foresters; 50-57. Davis, James B. 1990. The wildland-urban interface: paradise or battleground? Journal of Forestry 88(1): 26-31. Drysdale, Dougal. 1985. An introduction to fire dynamics. New York: John Wiley and Sons; 424 p. Karter, Michael J. 1992. NFPA reports on 1991 U.S. fire loss. National Fire Protective Association Journal 86(5): 32-43. Laughlin, Jerry; Page, Cynthia. 1987. Wildfire strikes home. In: Laughlin, Jerry; Page, Cynthia, editors. Report of the national wildland/urban fire protection conference; 1986 September; Denver, CO. NFPA No. SPP-86. Quincy, MA: National Fire Protection Association; 89 p. Tran, Hao C.; Cohen, Jack D.; Chase, Richard A. 1992. Modeling ignition of structures in wildland/urban interface fires. In: Proceedings of the 1st international fire and materials conference; 1992 September 24-25; Arlington, VA. London, UK: Inter Science Communications Limited; 253-262. USDA Forest Service Gen. Tech. Rep. PSW-GTR-158. 1995.

