Physics Animations Guide - usna.edu/Users/physics/tank/default.html
advertisement

Physics Animations Guide - usna.edu/Users/physics/tank/default.html
tank@usna.edu
These animations originate as .gif generated using Mathematica.
FrameNumberMovies:
These movies tag each frame with a frame number to facilitate collecting data vs. time or other key
parameter.
HelmholtzFieldVsSep: Displays on axis field plot for a coil pair with the coil pair separation as a
parameter
widthOscCompareFrmNumber
Fourier: See the ‘detailed’ animations in the Fourier series collections.
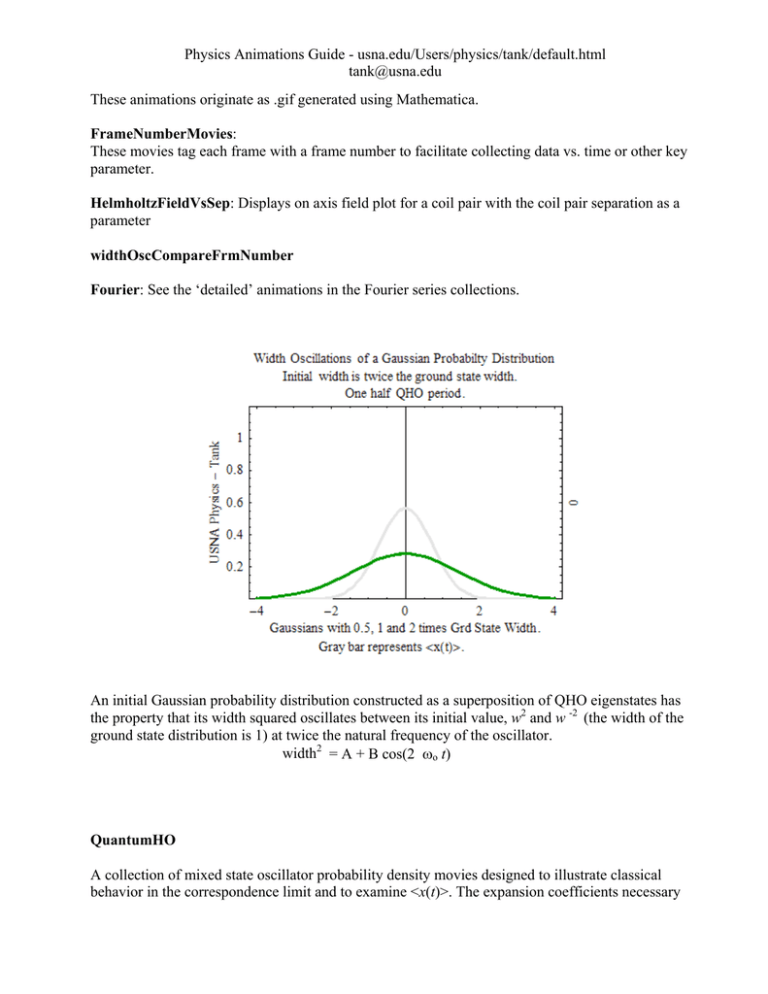
An initial Gaussian probability distribution constructed as a superposition of QHO eigenstates has
the property that its width squared oscillates between its initial value, w2 and w -2 (the width of the
ground state distribution is 1) at twice the natural frequency of the oscillator.
width2 = A + B cos(2 ωo t)
QuantumHO
A collection of mixed state oscillator probability density movies designed to illustrate classical
behavior in the correspondence limit and to examine <x(t)>. The expansion coefficients necessary
Physics Animations Guide - usna.edu/Users/physics/tank/default.html
tank@usna.edu
for these movies were computed in closed form, but it is just as effective and probably more
instructive to setup the overlap integrals and let Mathematica complete the process.
Correspondence OscillatorCompFinal: This movie illustrates that a Gaussian probability
distribution with the same width as the ground state displaced by d (from x = 0) will oscillate with
constant width at the natural frequency. If a wider (narrower) distribution is chosen, width
oscillations as well as harmonic translation occur (see the frame number movie above).
Correspondence OscillatorNarrow: Just the blue case from above.
SimpleCorrespOsc: the best example
osc0plus1mov: Equal mix of states 0 and 1 displaying <x>. The turning point for <x> is
accidentally at a peak in the probability density.
osc0ut23ExpX: Equal mix of states 2 and 3 displaying <x>. The turning point for <x> is NOT
accidentally at a peak in the probability density.
osc03ExpX: Equal mix of states 0 and 3 displaying <x>. Shows that <x> does not oscillate.
Collection is to show that x links n to n ± 1 only.
oscMovv11StateWith01Mix2: 01 Mix with a ‘correspondence’ state to illustrate that <x> for all
oscillates at the natural frequency.
WidthOscCompareHalfNoFrm; widthOscCompareTwiceNoFrm: Width oscillations of
Gaussians with width w times that of the ground state probability distribution
Physics Animations Guide - usna.edu/Users/physics/tank/default.html
tank@usna.edu
oscCorrWplusnm “Correspondence” state and a mn mixed state to demonstrate that the oscillation
frequency is the same.
Fourier:
A set of animations illustrating a Fourier series converging to a discontinuous function in the mean
using the -1 to +1 square wave. The discontinuity has magnitude 2. In the ‘detailed’ versions, the
approximate 9% overshoot can be seen.
A set of animations illustrating a Fourier series converging uniformly to a continuous function using
the -1 to +1 anti-symmetric triangle wave wave. The ‘detailed’ versions suggest that the convergence
is uniform.
The posted animations are based on the ones created by Prof. Nearing at the University of Miami.
http://www.physics.miami.edu/~nearing/mathmethods/
* Little known fact:
Albert Michelson (pre-discovery photo)
The Gibbs phenomenon was
discovered by Albert Michelson
while he was summing a
Fourier series with coefficients
for a periodic function that he
measured using an opticalmechanical system.
Michelson was a U S Naval
Academy midshipman and
instructor. One of his speed-of light measurements was made at
the academy.
Michelson-Stratton
harmonic analyzer
Michelson:
MichelsonEqualL; MichelsonGreen2; MichelsonSodium: Michelson ring patterns as the
apparatus is adjusted through the equal path length condition. If an adjustment toward the equal path
condition is made, the rings move inward, and the ring widths increase. Both behaviors can be used
as guides to reach the equal-path-length condition necessary to observe white light fringes.
Physics Animations Guide - usna.edu/Users/physics/tank/default.html
tank@usna.edu
The B/W movies are DensityPlots; the color movies are ArrayPlots.
michelsonGreen =Table[
ArrayPlot[
Table[
IntegerPart[128 * (1 + Cos[d - d (i^2 +j^2)/2^15 ])],{i,-127,128},{j,-127,128}],ColorRules →
colorArrayInt, DisplayFunction → Identity],{d,-50,50,0.5}]
MichelsonFakedWashouts: Weak representations of the sodium washouts. The sodium washouts
are dramatic because the lines are closely spaced so the washout persists for many cycles. Memory
limitations required that a 5% difference be used for these examples.
PlaneWaveAndPackets:
free-particle packets
WavePacketSpreadCompare: The spreading of three translating wave packets with different initial
widths is compared. The narrowest packet displays strong chirping after spreading.
WavePacketRI: Plots the real and imaginary parts of a wave packet. Comparison shows that the
parts behave similarly. This observation justifies plotting the real part only. *** This movie also
shows the dramatic difference between the group and phase velocities for free particle packets.
Physics Animations Guide - usna.edu/Users/physics/tank/default.html
tank@usna.edu
MultiSourceSuperposition:
A collection of animations based on a notebook prepared by Steve Montgomery. The waves are
modeled as cylindrical and the amplitude decrease with distance is included.
The movies (f1f1) have two sources in phase at the same frequency with either a wide or close
separation. Movies with f1f2 in the name show the behavior for sources with different frequencies.
The enclosed IntensityMultiSource plots are of intensity rather than net wave amplitude. The
collection includes a three source animation in which secondary lobes are visible. The four source
examples show the secondary lobes pairs. The four source examples include in phase, π/6, π/2 and
end-fire source to source relative phases.
Six source end-fire. The distance dependence was altered to 1/Sqrt[1 + distance] for the amplitude to
suppress the divergences near the sources. The plots where made using ArrayPlot to force a value to
color level mapping.
Physics Animations Guide - usna.edu/Users/physics/tank/default.html
tank@usna.edu
Animations for Physics and Math Methods Sites
http://www.physics.miami.edu/~nearing/mathmethods/ Prof. Nearing animates series expansions
and adds some drumhead mode movies. The Fourier series movie set is well suited to a discussion of
the Gibbs phenomenon.

