The Sun Our Star
advertisement
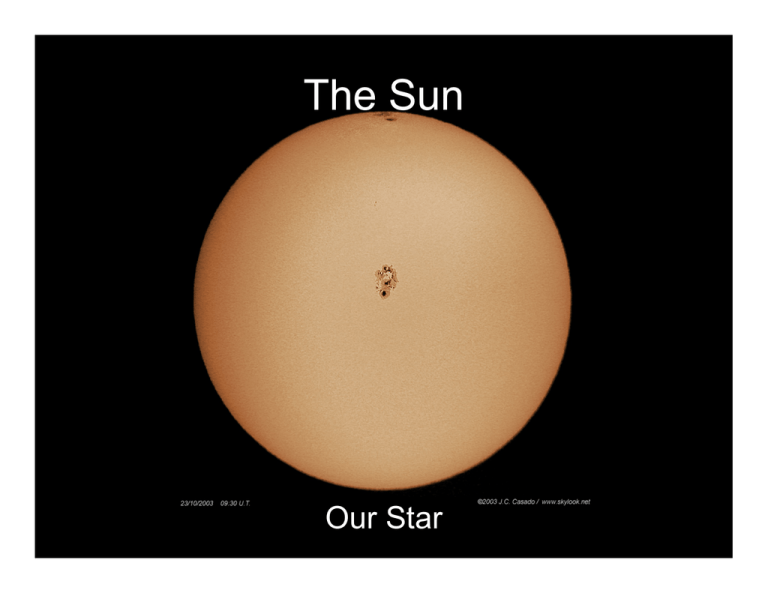
The Sun Our Star What we know about the Sun • Angular Diameter θ = 32 arcmin (from observations) • Solar Constant f = 1.4 x 10⁶ erg/sec/cm2 (from observations) • Distance d = 1.5 x 10⁸ km (1 AU). (from Kepler's Third Law and the trigonometric parallax of Venus) • Luminosity L = 4 x 1033 erg/s. (from the inverse-square law: L = 4π d2 f) • Radius R = 7 x 10⁵ km. (from geometry: R = π d) • Mass M = 2 x 1033 gm. (from Newton's version of Kepler's Third Law, M = (4π2/G) d3/P2) • Temperature T = 5800 K. (from the black body law: L = 4πR2 σ T4) • Composition about 74% Hydrogen, 24% Helium, and 2% everything else (by mass). (from spectroscopy) The Solar Surface The photosphere. The visible light disk. Galileo observed sunspots (earlier noted by Chinese observers) • Sunspots are regions of intense magnetic fields • Sunspots appear dark because they are cooler than the photosphere • A large sunspot is brighter than the full moon. Solar Photosphere Solar Granulation Real time: 20 minutes Naked-eye Sunpots Sunspots Pressure balance: Gas pressure + magnetic pressure in spot = gas pressure outside spot Bs ~ 2kG Ts ~ 4500K Photospheric Magnetic Fields Zeeman Effect The Solar Magnetic Field The Solar Magnetic Field The Solar Magnetic Field Temperature Profile Solar Atmospheric Structure • • • • • • Photosphere: 5760K; 0 km Temperature minimum: ~4000K, 500 km Chromosphere: 8000-20000K, 500-2000 km Transition Region: .02 - 1 MK, 2000 km Corona: >106 K, >2000 km Wind: >106 K, >2000 km • Note heights are mean, and density-dependent The Chromosphere • First noticed in total solar eclipses. • Name from the red color (from an emission line of Hydrogen) • Hot (8000-20,000K) gas heated by magnetic fields. • Bright regions known as plage. H-alpha image Sunspots The Corona The diffuse outer atmospheres of the Sun. The X-ray corona The white-light corona Also, the K corona - sunlight scattered from interplanetary dust The Corona Flares The Magnetic Cycle Spot cycle ~11 years Magnetic cycle ~22 yrs The Magnetic Cycle The Butterfly Diagram Solar Irradiance Coronal Cycle Coronal Mass Ejections Coronal Mass Ejections Coronal Mass Ejections The 1 Sept 1859 Flare • 9/1: Carrington observed white-light flare • 9/2: Brilliant auroras seen (as far south as the Caribbean) • Telegraphs functioned w/o batteries • Telegraph operators shocked • First solar flare recorded • Strongest in ~500 years • Today it would – Bring down the electrical grid – Fry satellites The 23 July 2012 Flare • 2 CMEs recorded • At least as energetic as the Carrington 1859 event • Missed the earth by about 1 week • Estimated economic impact: – $2 trillion ($2 x 10¹²) – 20 x greater than Katrina – Heavy-duty transformers destroyed; take years to manufacture – Power grid impacted for years http://science.nasa.gov/science-news/science-at-nasa/ 2014/23jul_superstorm/ The Odds 12% in the next decade More Pictures and References • Solar Data Analysis Center (SDAC): http://umbra.nascom.nasa.gov/ includes links to SOHO, SDO, HINODE, and YOHKOH Other Solar Missions: – STEREO: http://www.nasa.gov/mission_pages/stereo/main/ index.html – TRACE: http://trace.lmsal.com/ Solar Storms – https://medium.com/starts-with-a-bang/the-truth-about-solarstorms-1ab160203da4
