What is the Final Shape of a Viscoplastic Slump?
advertisement

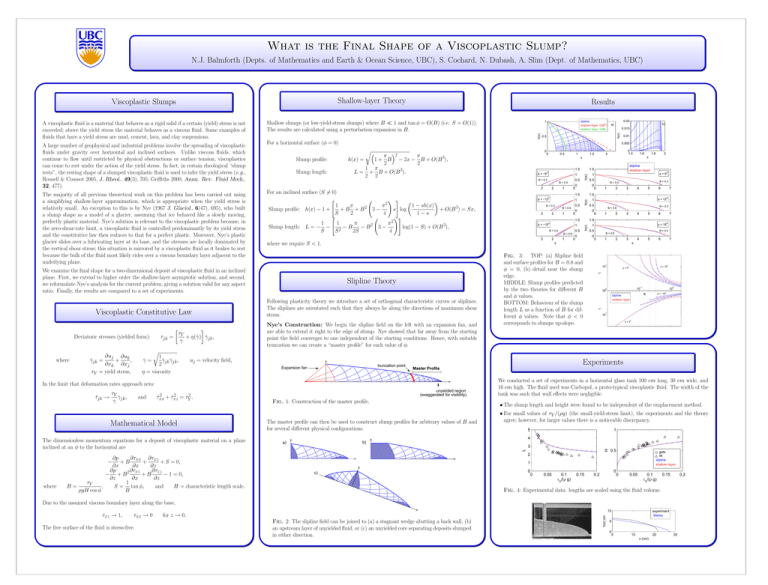
What is the Final Shape of a Viscoplastic Slump? N.J. Balmforth (Depts. of Mathematics and Earth & Ocean Science, UBC), S. Cochard, N. Dubash, A. Slim (Dept. of Mathematics, UBC) Viscoplastic Slumps Shallow-layer Theory A viscoplastic fluid is a material that behaves as a rigid solid if a certain (yield) stress is not exceeded; above the yield stress the material behaves as a viscous fluid. Some examples of fluids that have a yield stress are mud, cement, lava, and clay suspensions. Shallow slumps (or low-yield-stress slumps) where B 1 and tan φ = O(B) (i.e. S = O(1)). The results are calculated using a perturbation expansion in B. A large number of geophysical and industrial problems involve the spreading of viscoplastic fluids under gravity over horizontal and inclined surfaces. Unlike viscous fluids, which continue to flow until restricted by physical obstructions or surface tension, viscoplastics can come to rest under the action of the yield stress. In fact, in certain rheological “slump tests”, the resting shape of a slumped viscoplastic fluid is used to infer the yield stress (e.g., Rousell & Coussot 2005, J. Rheol., 49(3), 705; Griffiths 2000, Annu. Rev. Fluid Mech., 32, 477). For a horizontal surface (φ = 0) The majority of all previous theoretical work on this problem has been carried out using a simplifying shallow-layer approximation, which is appropriate when the yield stress is relatively small. An exception to this is by Nye (1967 J. Glaciol., 6(47), 695), who built a slump shape as a model of a glacier, assuming that ice behaved like a slowly moving, perfectly plastic material. Nye’s solution is relevant to the viscoplastic problem because, in the zero-shear-rate limit, a viscoplastic fluid is controlled predominantly by its yield stress and the constitutive law then reduces to that for a perfect plastic. Moreover, Nye’s plastic glacier slides over a lubricating layer at its base, and the stresses are locally dominated by the vertical shear stress; this situation is mirrored by a viscoplastic fluid as it brakes to rest because the bulk of the fluid most likely rides over a viscous boundary layer adjacent to the underlying plane. For an inclined surface (S 6= 0) " ! # 2 1 π π 1 − sh(x) 2 Slump profile: h(x) − 1 + +B +B 3− s log + O(B 3) = Sx, S 2 4 1−s " !# 2 1 1 π π 2 3− 3), Slump length: L = − − − B log(1 − S) + O(B − B S 2S 4 S2 where r 1 γ̇jk γ̇jk , γ̇ = 2 η = viscosity π π 2 h(x) = 1 + B − 2x − B + O(B 3), 2 2 1 π L = + B + O(B 3). 2 2 Mathematical Model The dimensionless momentum equations for a deposit of viscoplastic material on a plane inclined at an φ to the horizontal are where ∂p ∂τxx ∂τxz − +B + + S = 0, ∂x ∂x ∂z ∂τxz ∂p ∂τzz 2 − +B +B − 1 = 0, ∂z ∂x ∂z 1 τY B= , S = tan φ, and H = characteristic length scale. ρgH cos φ B h(x) 1 0.01 1.5 0 1.4 2 o φ = −6 2 1 h(x) 0.5 0 0 φ = −12 3 2 1 h(x) 0.5 B = 0.6 0 0 φ = −18 0.5 B = 0.8 2 where we require S < 1. 1 0 0 1 2 3 4 truncation point Expansion fan 6 7 o φ = 12 0.5 B = 0.3 B = 0.6 0 1 2 3 4 5 6 7 0 φ = 18o 1 0.5 0 B = 0.4 B = 0.8 0 1 2 3 4 x Nye’s Construction: We begin the slipline field on the left with an expansion fan, and are able to extend it right to the edge of slump. Nye showed that far away from the starting point the field converges to one independent of the starting conditions. Hence, with suitable truncation we can create a “master profile” for each value of φ. 5 1.5 1 B = 0.4 B = 0.2 B = 0.4 1 0 1.5 o 0.5 1.5 1 B = 0.3 o φ=6 1 0 1.5 o 2 slipline shallow−layer 1.5 1 3 1.8 x 1.5 3 5 6 7 x 1 10 φ = 18o φ = 0o L Fig. 3: TOP: (a) Slipline field and surface profiles for B = 0.8 and φ = 0, (b) detail near the slump edge. MIDDLE: Slump profiles predicted by the two theories for different B and φ values. BOTTOM: Behaviour of the slump length L as a function of B for different φ values. Note that φ < 0 corresponds to slumps up-slope. −1 0 10 0 10 10 φ = −18o B slipline shallow−layer L Slipline Theory 1.6 x B = 0.4 uj = velocity field, 2 + τ̂ 2 = τ 2 . τ̂xx xz Y 0.5 1 10 φ = 0o Experiments Master Profile unyielded region (exaggerated for visibility) Fig. 1: Construction of the master profile. The master profile can then be used to construct slump profiles for arbitrary values of B and for several different physical configurations. We conducted a set of experiments in a horizontal glass tank 100 cm long, 30 cm wide, and 16 cm high. The fluid used was Carbopol, a proto-typical viscoplastic fluid. The width of the tank was such that wall effects were negligible. • The slump length and height were found to be independent of the emplacement method. • For small values of τY /(ρg) (the small-yield-stress limit), the experiments and the theory agree; however, for larger values there is a noticeable discrepancy. 5 1 4 b) a) 3 L and 0 B = 0.2 In the limit that deformation rates approach zero: τY τ̂jk → γ̇jk , γ̇ 0 r H τY + η(γ̇) γ̇jk , τjk = γ̇ Deviatoric stresses (yielded form): ∂uj ∂uk + , γ̇jk = ∂xk ∂xj τY = yield stress, 0.015 0.005 Following plasticity theory we introduce a set of orthogonal characteristic curves or sliplines. The sliplines are orientated such that they always lie along the directions of maximum shear stress. Viscoplastic Constitutive Law b) a) 0.5 h(x) Slump length: 0.02 slipline shallow−layer O(B3) shallow−layer O(B) 1 h(x) Slump profile: We examine the final shape for a two-dimensional deposit of viscoplastic fluid in an inclined plane. First, we extend to higher order the shallow-layer asymptotic solution, and second, we reformulate Nye’s analysis for the current problem, giving a solution valid for any aspect ratio. Finally, the results are compared to a set of experiments. Results 0.5 gate tilt slipline shallow−layer 2 1 c) 0 0 0.05 0.1 τY/(ρ g) 0.15 0 0.2 0 0.05 0.1 τY/(ρ g) 0.15 0.2 Fig. 4: Experimental data: lengths are scaled using the fluid volume. Due to the assumed viscous boundary layer along the base, τxz → 1, τxx → 0 The free surface of the fluid is stress-free. for z → 0. Fig. 2: The slipline field can be joined to (a) a stagnant wedge abutting a back wall, (b) an upstream layer of unyielded fluid, or (c) an unyielded core separating deposits slumped in either direction. h(x) cm 10 experiment theory 5 0 0 10 20 x (cm) 30


