Network Visualization for Directional Routing in Ad-Hoc Networks Introduction Results
advertisement

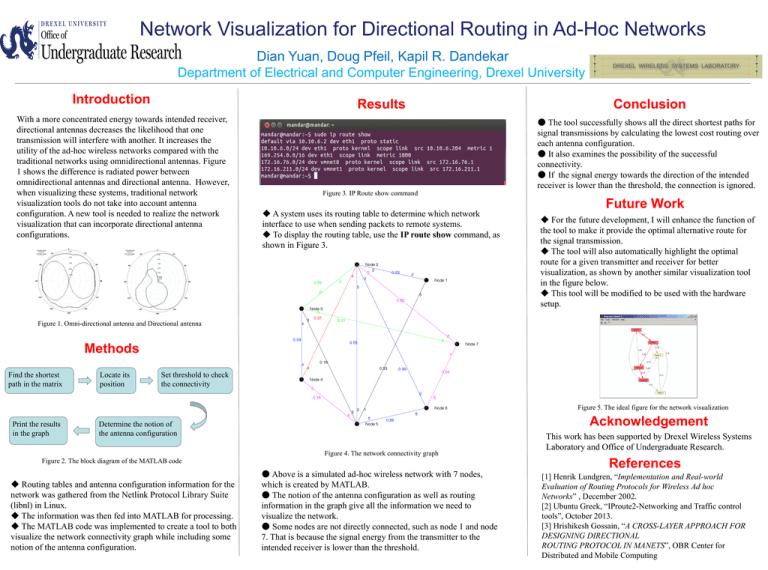
Network Visualization for Directional Routing in Ad-Hoc Networks Dian Yuan, Doug Pfeil, Kapil R. Dandekar Department of Electrical and Computer Engineering, Drexel University Introduction Results With a more concentrated energy towards intended receiver, directional antennas decreases the likelihood that one transmission will interfere with another. It increases the utility of the ad-hoc wireless networks compared with the traditional networks using omnidirectional antennas. Figure 1 shows the difference is radiated power between omnidirectional antennas and directional antenna. However, when visualizing these systems, traditional network visualization tools do not take into account antenna configuration. A new tool is needed to realize the network visualization that can incorporate directional antenna configurations. Conclusion ● The tool successfully shows all the direct shortest paths for signal transmissions by calculating the lowest cost routing over each antenna configuration. ● It also examines the possibility of the successful connectivity. ● If the signal energy towards the direction of the intended receiver is lower than the threshold, the connection is ignored. Figure 3. IP Route show command ◆ A system uses its routing table to determine which network interface to use when sending packets to remote systems. ◆ To display the routing table, use the IP route show command, as shown in Figure 3. Future Work ◆ For the future development, I will enhance the function of the tool to make it provide the optimal alternative route for the signal transmission. ◆ The tool will also automatically highlight the optimal route for a given transmitter and receiver for better visualization, as shown by another similar visualization tool in the figure below. ◆ This tool will be modified to be used with the hardware setup. Figure 1. Omni-directional antenna and Directional antenna Methods Find the shortest path in the matrix Locate its position Set threshold to check the connectivity Figure 5. The ideal figure for the network visualization Print the results in the graph Acknowledgement Determine the notion of the antenna configuration Figure 4. The network connectivity graph Figure 2. The block diagram of the MATLAB code ◆ Routing tables and antenna configuration information for the network was gathered from the Netlink Protocol Library Suite (libnl) in Linux. ◆ The information was then fed into MATLAB for processing. ◆ The MATLAB code was implemented to create a tool to both visualize the network connectivity graph while including some notion of the antenna configuration. ● Above is a simulated ad-hoc wireless network with 7 nodes, which is created by MATLAB. ● The notion of the antenna configuration as well as routing information in the graph give all the information we need to visualize the network. ● Some nodes are not directly connected, such as node 1 and node 7. That is because the signal energy from the transmitter to the intended receiver is lower than the threshold. This work has been supported by Drexel Wireless Systems Laboratory and Office of Undergraduate Research. References [1] Henrik Lundgren, “Implementation and Real-world Evaluation of Routing Protocols for Wireless Ad hoc Networks” , December 2002. [2] Ubuntu Greek, “IProute2-Networking and Traffic control tools”, October 2013. [3] Hrishikesh Gossain, “A CROSS-LAYER APPROACH FOR DESIGNING DIRECTIONAL ROUTING PROTOCOL IN MANETS”, OBR Center for Distributed and Mobile Computing


