Document 11129463

(—THIS SIDEBAR DOES NOT PRINT—)
D E S I G N G U I D E
This PowerPoint 2007 template produces a 36”x48” presentation poster. You can use it to create your research poster and save valuable time placing titles, subtitles, text, and graphics.
We provide a series of online tutorials that will guide you through the poster design process and answer your poster production questions. To view our template tutorials, go online to
PosterPresentations.com
and click on HELP DESK.
When you are ready to print your poster, go online to
PosterPresentations.com
Need assistance? Call us at 1.510.649.3001
Q U I C K S TA RT
Zoom in and out
As you work on your poster zoom in and out to the level that is more comfortable to you.
Go to VIEW > ZOOM.
Title, Authors, and Affiliations
Start designing your poster by adding the title, the names of the authors, and the affiliated institutions. You can type or paste text into the provided boxes. The template will automatically adjust the size of your text to fit the title box. You can manually override this feature and change the size of your text.
T I P : The font size of your title should be bigger than your name(s) and institution name(s).
Adding Logos / Seals
Most often, logos are added on each side of the title. You can insert a logo by dragging and dropping it from your desktop, copy and paste or by going to INSERT > PICTURES. Logos taken from web sites are likely to be low quality when printed. Zoom it at 100% to see what the logo will look like on the final poster and make any necessary adjustments.
T I P : See if your school’s logo is available on our free poster templates page.
Photographs / Graphics
You can add images by dragging and dropping from your desktop, copy and paste, or by going to INSERT > PICTURES. Resize images proportionally by holding down the SHIFT key and dragging one of the corner handles. For a professional-looking poster, do not distort your images by enlarging them disproportionally.
ORIGINAL
Corner handles
DISTORTED
Image Quality Check
Zoom in and look at your images at 100% magnification. If they look good they will print well.
T
HE EFFECT OF MATERNAL OBESITY ON BIRTH WEIGHT
:
A RETROSPECTIVE COHORT STUDY
1
Irani R,
1
Yao R,
3
Park BY,
1,2
Croft DJ,
1,2
Plante LA
Drexel University College of Medicine,
1
Department of Obstetrics and Gynecology,
2
Division of Maternal-fetal Medicine,
3
School of Public Health
Introduction
There is a dose-dependent relationship between obesity and stillbirth 1-3 which is most evident in the late third trimester 1 .
An improved understanding of the effect of maternal obesity on fetal growth velocity may shed light on the pathophysiology behind the association between obesity and stillbirth.
GOAL: to establish the pattern of fetal growth throughout gestation among obese women based on the weight of their infants at delivery in comparison to the normal growth curve.
Methods
Retrospective cohort study.
Birth data obtained from the Texas Vital Records
Database from 2006-2011.
1,849,773 births were used in analysis after exclusion criteria were applied
Linear regression used to assess the rate of fetal growth throughout gestation.
% of large and small for gestational age (LGA and
SGA) deliveries for each Body Mass Index (BMI) class at each gestational week was compared to those of non-obese women.
Logistic regression was used to obtain the adjusted odds ratio for deliveries of LGA and SGA infants within each BMI class.
STATA 12 was used for statistical analyses
.
Figure 1: Cohort Selection
Texas Birth Registry
2,422,520
Multiple Gestation: 75,082
2,347,438
Gestational Age <20 or >42 weeks: 5,733
2,341,705
Severe Fetal Anomalies: 3,922
2,337,783
Missing Variables: 18,424
2,319,359
Underweight (BMI <18.5) and Maternal
Height<48inches : 111,318
2,208,041
Deliveries Included in Analysis
1,825,194
Medical Comorbidities: 382,847
Pregestational Diabetes: 14,432
Pregestational Hypertension: 16,942
Gestational Diabetes: 89,220
Gestational Hypertension: 89,220
Eclampsia: 2,279
Smoking: 166,242
Results
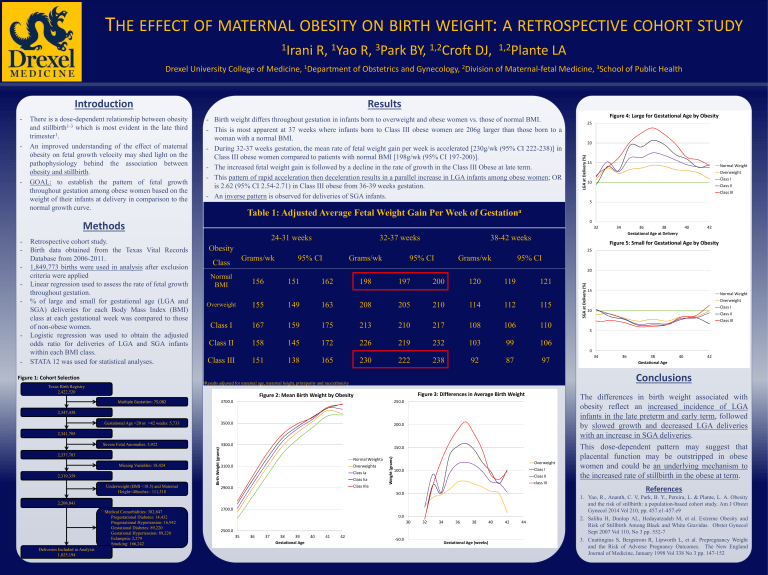
- Birth weight differs throughout gestation in infants born to overweight and obese women vs. those of normal BMI.
- This is most apparent at 37 weeks where infants born to Class III obese women are 206g larger than those born to a woman with a normal BMI.
- During 32-37 weeks gestation, the mean rate of fetal weight gain per week is accelerated [230g/wk (95% CI 222-238)] in
Class III obese women compared to patients with normal BMI [198g/wk (95% CI 197-200)].
- The increased fetal weight gain is followed by a decline in the rate of growth in the Class III Obese at late term.
- This pattern of rapid acceleration then deceleration results in a parallel increase in LGA infants among obese women; OR is 2.62 (95% CI 2.54-2.71) in Class III obese from 36-39 weeks gestation.
- An inverse pattern is observed for deliveries of SGA infants.
Table 1: Adjusted Average Fetal Weight Gain Per Week of Gestation
a
24-31 weeks
Obesity
Class
Grams/wk 95% CI
Normal
BMI
156 151 162
Overweight
155
Class I 167
Class II 158
Class III 151
149
159
145
138
163
175
172
165
Grams/wk a Results adjusted for maternal age, maternal height, primiparity and race/ethnicity
Figure 2: Mean Birth Weight by Obesity
3700.0
3500.0
3300.0
3100.0
2900.0
2700.0
2500.0
35 36 37 38 39
Gestational Age
40 41 42
198
208
213
226
230
32-37 weeks
197
250.0
200.0
150.0
Normal Weighta
Overweighta
Class Ia
Class Iia
Class IIIa
100.0
50.0
205
210
219
222
95% CI
200
210
217
232
238
Grams/wk
120
114
108
103
92
38-42 weeks
119
112
106
99
87
95% CI
Figure 3: Differences in Average Birth Weight
0.0
30 32 34 36 38 40 42 44
-50.0
Gestational Age (weeks)
121
115
110
106
97
Overweight
Class I
Class II class III
20
15
10
5
Figure 4: Large for Gestational Age by Obesity
25
20
15
10
5
0
32 34 36 38
Gestational Age at Delivery
40 42
Figure 5: Small for Gestational Age by Obesity
25
Normal Weight
Overweight
Class I
Class II
Class III
Normal Weight
Overweight
Class I
Class II
Class III
0
34 36 38
Gestational Age
40
Conclusions
42
The differences in birth weight associated with obesity reflect an increased incidence of LGA infants in the late preterm and early term, followed by slowed growth and decreased LGA deliveries with an increase in SGA deliveries.
This dose-dependent pattern may suggest that placental function may be outstripped in obese women and could be an underlying mechanism to the increased rate of stillbirth in the obese at term.
References
1. Yao, R., Ananth, C. V, Park, B. Y., Pereira, L. & Plante, L. A. Obesity and the risk of stillbirth: a population-based cohort study. Am J Obstet
Gynecol 2014 Vol 210, pp. 457.e1-457.e9
2. Salihu H, Dunlop AL, Hedayatzadeh M, et al. Extreme Obesity and
Risk of Stillbirth Among Black and White Gravidas. Obstet Gynecol
Sept 2007 Vol 110, No 3 pp. 552-7
3. Cnattingius S, Bergstrom R, Lipworth L, et al. Prepregnancy Weight and the Risk of Adverse Pregnancy Outcomes. The New England
Journal of Medicine, January 1998 Vol 338 No 3 pp. 147-152
Q U I C K S TA RT ( c o n t . )
How to change the template color theme
You can easily change the color theme of your poster by going to the
DESIGN menu, click on COLORS, and choose the color theme of your choice. You can also create your own color theme.
You can also manually change the color of your background by going to
VIEW > SLIDE MASTER. After you finish working on the master be sure to go to VIEW > NORMAL to continue working on your poster.
How to add Text
The template comes with a number of preformatted placeholders for headers and text blocks. You can add more blocks by copying and pasting the existing ones or by adding a text box from the HOME menu.
Text size
Adjust the size of your text based on how much content you have to present. The default template text offers a good starting point. Follow the conference requirements.
How to add Tables
To add a table from scratch go to the INSERT menu and click on TABLE. A drop-down box will help you select rows and columns.
You can also copy and a paste a table from Word or another PowerPoint document. A pasted table may need to be re-formatted by RIGHT-CLICK >
FORMAT SHAPE, TEXT BOX, Margins.
Graphs / Charts
You can simply copy and paste charts and graphs from Excel or Word.
Some reformatting may be required depending on how the original document has been created.
How to change the column configuration
RIGHT-CLICK on the poster background and select LAYOUT to see the column options available for this template. The poster columns can also be customized on the Master. VIEW > MASTER.
How to remove the info bars
If you are working in PowerPoint for Windows and have finished your poster, save as PDF and the bars will not be included. You can also delete them by going to VIEW > MASTER. On the Mac adjust the Page-Setup to match the Page-Setup in PowerPoint before you create a PDF. You can also delete them from the Slide Master.
Save your work
Save your template as a PowerPoint document. For printing, save as
PowerPoint of “Print-quality” PDF.
Print your poster
When you are ready to have your poster printed go online to
PosterPresentations.com and click on the “Order Your Poster” button.
Choose the poster type the best suits your needs and submit your order.
If you submit a PowerPoint document you will be receiving a PDF proof for your approval prior to printing. If your order is placed and paid for before noon, Pacific, Monday through Friday, your order will ship out that same day. Next day, Second day, Third day, and Free Ground services are offered. Go to PosterPresentations.com for more information.
Student discounts are available on our Facebook page.
Go to PosterPresentations.com and click on the FB icon.
© 2013 PosterPresentations.com
2117 Fourth Street , Unit C
Berkeley CA 94710


