Math 441 Assignment 2 Slick Petroleum Company due Friday, Jan. 26, 1996
advertisement
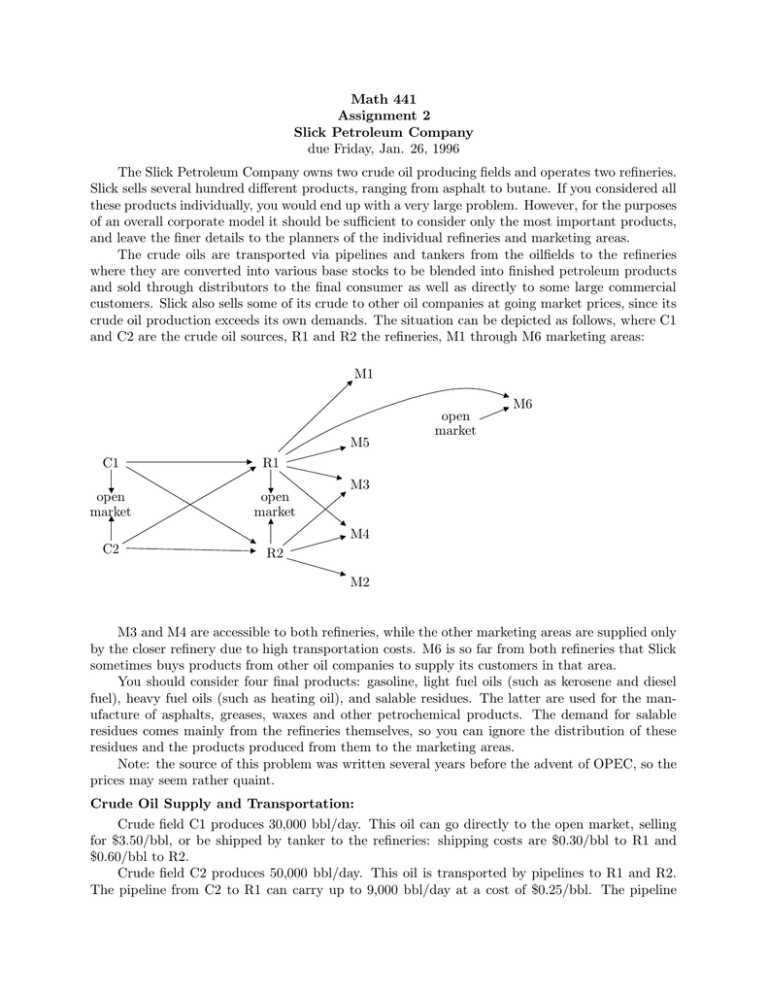
Math 441 Assignment 2 Slick Petroleum Company due Friday, Jan. 26, 1996 The Slick Petroleum Company owns two crude oil producing fields and operates two refineries. Slick sells several hundred different products, ranging from asphalt to butane. If you considered all these products individually, you would end up with a very large problem. However, for the purposes of an overall corporate model it should be sufficient to consider only the most important products, and leave the finer details to the planners of the individual refineries and marketing areas. The crude oils are transported via pipelines and tankers from the oilfields to the refineries where they are converted into various base stocks to be blended into finished petroleum products and sold through distributors to the final consumer as well as directly to some large commercial customers. Slick also sells some of its crude to other oil companies at going market prices, since its crude oil production exceeds its own demands. The situation can be depicted as follows, where C1 and C2 are the crude oil sources, R1 and R2 the refineries, M1 through M6 marketing areas: M1 M5 C1 R1 open market open market open market M6 M3 M4 C2 R2 M2 M3 and M4 are accessible to both refineries, while the other marketing areas are supplied only by the closer refinery due to high transportation costs. M6 is so far from both refineries that Slick sometimes buys products from other oil companies to supply its customers in that area. You should consider four final products: gasoline, light fuel oils (such as kerosene and diesel fuel), heavy fuel oils (such as heating oil), and salable residues. The latter are used for the manufacture of asphalts, greases, waxes and other petrochemical products. The demand for salable residues comes mainly from the refineries themselves, so you can ignore the distribution of these residues and the products produced from them to the marketing areas. Note: the source of this problem was written several years before the advent of OPEC, so the prices may seem rather quaint. Crude Oil Supply and Transportation: Crude field C1 produces 30,000 bbl/day. This oil can go directly to the open market, selling for $3.50/bbl, or be shipped by tanker to the refineries: shipping costs are $0.30/bbl to R1 and $0.60/bbl to R2. Crude field C2 produces 50,000 bbl/day. This oil is transported by pipelines to R1 and R2. The pipeline from C2 to R1 can carry up to 9,000 bbl/day at a cost of $0.25/bbl. The pipeline from C2 to R2 can carry up to 44,000 bbl/day at a cost of $0.15/bbl. From the pipeline terminal at R2, crude oil can be loaded into tankers and shipped to refinery R1 at a cost of $0.40/bbl, sold on the open market at $2.50/bbl, or used in R2. Note that open-market sales of oil from C1 occur directly at the oilfield, but from C2 only at the pipeline terminal at R2. Refining: Refinery R1 can process up to 40,000 bbl/day of crude oil, while R2 can process up to 20,000 bbl/day. An oil refinery is a very complicated structure, but for the purposes of this model you can ignore its internal processes and consider it as a “black box” that transforms crude oil inputs into finished product outputs. For any given crude oil input, there can be considerable flexibility in adjusting the output mix. This can be reflected by considering two or more different yield structures. Slick’s two refineries are quite different. R1 is very modern and allows considerable flexibility, but for each crude oil there are two yield structures that are particularly advantageous: a low gasoline yield structure and a high gasoline yield structure. You are free to mix these in any proportions, i.e. any amounts of each crude can be processed according to each yield structure, except that due to cracking capacity limitations not more than 25,000 bbl/day of crude C1 or equivalent can be processed using the high gasoline yield structure. For the purposes of this capacity, one barrel of crude C2 is equivalent to 1.4 barrels of crude C1. Refinery R2, on the other hand, is older and not as flexible, and in fact for each crude there is only one yield structure worth considering. The following table summarizes the yield structures and processing costs for the two refineries: Refinery R1 Refinery R2 Low Gasoline Structure High Gasoline Structure Crude C1 C2 C1 C2 C1 C2 Percent Yields gasoline light fuel oil 49 15 35 14 67 19 59 18 54 14 39 16 heavy fuel oil salable residues waste 29 7 0 40 10 1 10 3 1 15 6 2 25 6 1 35 8 2 1.40 1.60 1.70 2.10 1.60 1.70 Processing cost ($/bbl input) Distribution: As mentioned before, the demand for salable residues occurs directly at the refineries. All the salable residues that can be produced will be used, bringing in a net revenue of $1.80/bbl at R1 and $2.10/bbl at R2. The table below contains the demands and net sales prices for each of the remaining commodities in each of the six marketing areas, and in the open market. The demand figures in M1 through M6 must be met exactly. The demands in the open market are maximum amounts. Gasoline Demand Price Light fuel oil Demand Price Heavy fuel oil Demand Price Area bbl/day $/bbl bbl/day $/bbl bbl/day $/bbl M1 M2 M3 9,900 6,800 6,100 8.20 8.20 8.20 3,300 2,600 2,200 4.80 4.80 5.00 4,200 3,800 3,200 3.20 3.30 3.60 M4 M5 4,200 3,200 8.60 9.10 900 600 5.20 5.40 800 0 3.80 — M6 1,800 9.50 400 5.60 0 — Open Market at R1 at R2 0 0 — — 0 0 — — 6,000 2,000 2.50 2.70 Marketing Open Market buying prices M6 8.80 5.20 The following table shows the transportation costs from the refineries to the marketing areas. Note that some of these routes are too costly to consider, and therefore are represented by dashes —. The costs are the same for all commodities. Transportation Costs ($/bbl) Marketing Area Refinery R1 R2 M1 .20 — M2 — .20 M3 .30 .25 M4 .40 .30 M5 .40 — M6 .80 — Questions Slick’s objective is to maximize profits, defined in this context as the difference between revenues and costs (not counting fixed costs, such as overhead). Find the best plan for the corporation. You may use either LINDO or LINEAR. The production manager for oilfield C2 sees some possibility of increasing the crude output of this field from 50,000 bbl/day to 60,000 bbl/day. What would be the impact of this additional output? Slick is considering plans for substantial increases in refinery capacities, and in particular in cracking capacity. The managers for refineries R1 and R2 would both like to see this increased capacity. What is your advice? The marketing department sees the possibility of acquiring the account of a user of light oil in marketing area 1. The potential daily sales would amount to 80 bbl/day, at a sales price of $4.60/bbl. Should it attempt to obtain that account?
