EE354 Lab 4: Interview Grading Information Sheet
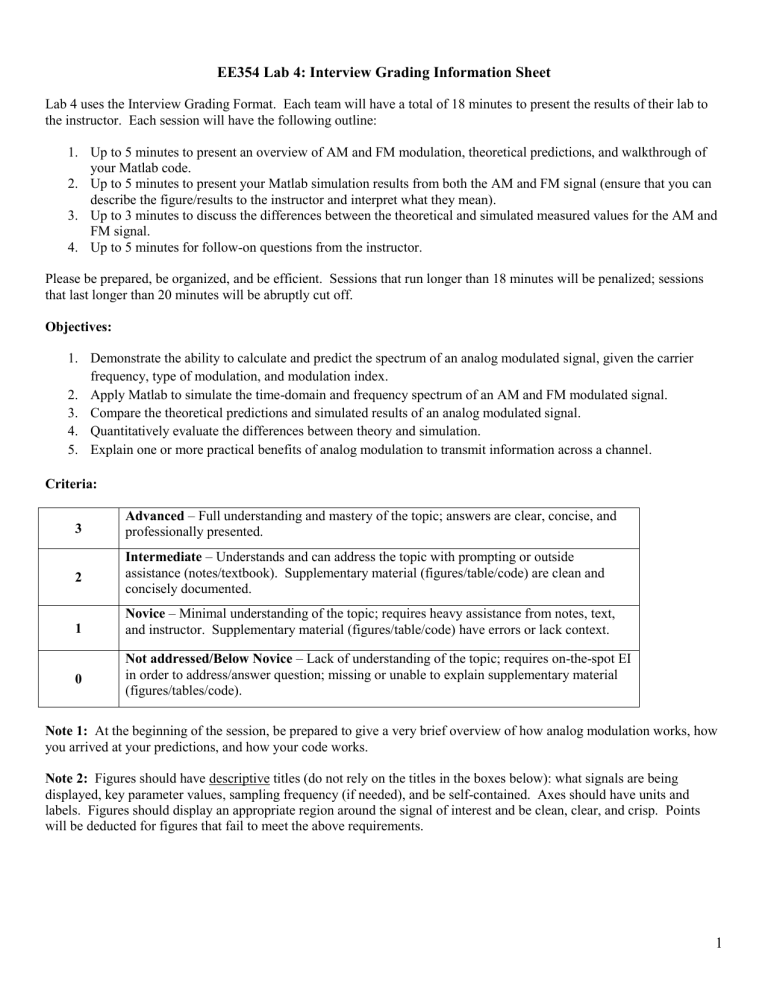
EE354 Lab 4: Interview Grading Information Sheet
Lab 4 uses the Interview Grading Format. Each team will have a total of 18 minutes to present the results of their lab to the instructor. Each session will have the following outline:
1.
Up to 5 minutes to present an overview of AM and FM modulation, theoretical predictions, and walkthrough of your Matlab code.
2.
Up to 5 minutes to present your Matlab simulation results from both the AM and FM signal (ensure that you can describe the figure/results to the instructor and interpret what they mean).
3.
Up to 3 minutes to discuss the differences between the theoretical and simulated measured values for the AM and
FM signal.
4.
Up to 5 minutes for follow-on questions from the instructor.
Please be prepared, be organized, and be efficient. Sessions that run longer than 18 minutes will be penalized; sessions that last longer than 20 minutes will be abruptly cut off.
Objectives:
1.
Demonstrate the ability to calculate and predict the spectrum of an analog modulated signal, given the carrier frequency, type of modulation, and modulation index.
2.
Apply Matlab to simulate the time-domain and frequency spectrum of an AM and FM modulated signal.
3.
Compare the theoretical predictions and simulated results of an analog modulated signal.
4.
Quantitatively evaluate the differences between theory and simulation.
5.
Explain one or more practical benefits of analog modulation to transmit information across a channel.
Criteria:
3
Advanced – Full understanding and mastery of the topic; answers are clear, concise, and professionally presented.
2
1
Intermediate – Understands and can address the topic with prompting or outside assistance (notes/textbook). Supplementary material (figures/table/code) are clean and concisely documented.
Novice – Minimal understanding of the topic; requires heavy assistance from notes, text, and instructor. Supplementary material (figures/table/code) have errors or lack context.
0
Not addressed/Below Novice – Lack of understanding of the topic; requires on-the-spot EI in order to address/answer question; missing or unable to explain supplementary material
(figures/tables/code).
Note 1: At the beginning of the session, be prepared to give a very brief overview of how analog modulation works, how you arrived at your predictions, and how your code works.
Note 2: Figures should have descriptive titles (do not rely on the titles in the boxes below): what signals are being displayed, key parameter values, sampling frequency (if needed), and be self-contained.
Axes should have units and labels. Figures should display an appropriate region around the signal of interest and be clean, clear, and crisp.
Points will be deducted for figures that fail to meet the above requirements.
1
Figures to have prepared
Show a meaningful amount of the time domain of each signal as well as a sufficiently detailed view of the frequency spectrum.
AM Signal in the Time Domain
AM Signal Frequency Spectrum (in dBm)
FM Signal in the Time Domain
FM Signal Frequency Spectrum
Tables to have prepared
Theoretical and Measured Characteristics of the AM Signal
Comparison of FM Spectra
2
Table 1: Theoretical and Measured Characteristics of the AM Signal
Parameter
Theoretical
Value
Matlab
Simulated
Value
Min value of envelope, A min
Max value of envelope, A max
Amplitude of carrier, A c
Modulation Index
AM Power Efficiency, η
Carrier Frequency, f
C
Upper Sideband Frequency, f
USB
Lower Sideband Frequency, f
LSB
RF Bandwidth
Overall power (50
load) (dBm), P
AM
Power of carrier (50
load) (dBm), P carrier
Power of Upper Sideband (50
load) (dBm), P
USB
Power of Lower Sideband (50
load) (dBm), P
LSB
Table 4: Comparison of FM Spectra
Theoretical
Normalized
Magnitude
Simulated
Normalized
Magnitude
LSB (associated with J
-4
)
LSB (associated with J
-3
)
LSB (associated with J
-2
)
LSB (associated with J
-1
)
Carrier (associated with J
0
)
USB (associated with J
1
)
USB (associated with J
2
)
USB (associated with J
3
)
USB (associated with J
4
)
3

