METODA SAŽETOG PRONALAŽENJA INFORMACIJA COMPRESSIVE SENSING Prof Dr Svetlana Avramov-Zamurović
advertisement
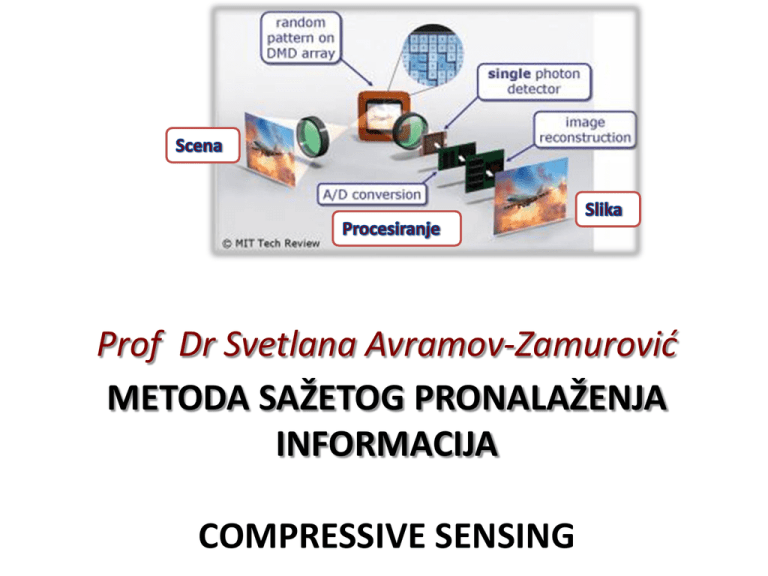
Prof Dr Svetlana Avramov-Zamurović METODA SAŽETOG PRONALAŽENJA INFORMACIJA COMPRESSIVE SENSING United States Naval Academy United States Naval Academy Annapolis Severn River History 1845 - Fort Severn Nine acres of land 50 Midshipmen 7 professors (3 civilian, 4 officers) Current - U.S. Naval Academy 338 acres of land 4,500 Midshipmen > 500 Faculty and Staff Admissions Annual average: • Applications - 12 000 • Admitted - 1200 U.S. students • Acceptance rate - 83% • Graduation rate - 82% Highly sought education… High graduation rate Post Commissioning Education Professional Education • 40% Aviation training (24 months) • 22% Marine Corps training (12 months) • 15% Nuclear engineering training (15 months) • 4% Special Warfare / Operations training (15 months) • 1.5% Medical school opportunities Graduate Education • Naval Postgraduate School • Naval War College • Civilian Universities Education Superintendent Academic Dean Engineering & Weapons Math & Science Athletic Director Commandant of Midshipmen Humanities & Soc. Sciences Professional Development Officer Development Aerospace Engineering Math Economics Sailing Leadership, Ethics & Law Electrical Engineering Chemistry English Seamanship & Navigation Character Development Mechanical Engineering Physics History Professional Programs NA & OE Oceanography Language Studies Waterfront Readiness Weapons & Systems Computer Science Political Science Director of Ath. Facilities Director of P.E. Academics 32 Varsity Sports Men's Baseball Basketball Crew Cross Country Football Golf Gymnastics Lacrosse Lightweight Crew Women’s Soccer Sprint Football Squash Swimming Tennis Track (indoor) Track (outdoor) Water Polo Wrestling Basketball Crew Cross Country Lacrosse Soccer Swimming Tennis Track (indoor) Track (outdoor) Volleyball Co-ed Diving Intercollegiate Sailing Offshore Sailing Rifle A Midshipman’s Daily Schedule 0600 0700 0800 0900 1000 1100 1200 1300 1400 1500 1600 1700 1800 1900 2000 2100 2200 2300 Personal Conditioning Breakfast 1st - 4th Academic Periods Lunch 5th – 6th Academic Periods Athletic Period Dinner Academic Study Period International Students at USNA Ac Year 2008-2009 (46 currently, limited to 60) Albania-1 Guyana-2 Malaysia-2 Romania-2 Algeria-2 Honduras-1 Maldives-1 Singapore-3 Belize-1 Ireland-1 Mauritius-1 S. Korea-1 Costa Rica-2 Jamaica-1 Montenegro-1 Taiwan-3 Kazakhstan-1 Pakistan-4 Thailand-1 El Salvador-1 Lithuania-3 Peru-1 Tunisia-2 Federated States of Micronesia-2 Madagascar-2 Philippines-1 Ecuador-3 Seven Languages Arabic Chinese French German Japanese Russian Spanish Major or Minor in a language All non-technical majors required to learn foreign language Summer Opportunities Commissioning 1 2 6 21 5 5 1 5 4 27 9 2 73 52 45 23 President of the United States Cabinet Members Ambassadors Members of Congress State Governors Secretaries of the Navy Secretary of the Air Force Chairmen of the Joint Chiefs of Staff Vice Chairmen of the Joint Chiefs of Staff Chiefs of Naval Operations Commandants of the Marine Corps Nobel Prize Awardees Medal of Honor Awardees Astronauts Rhodes Scholars Marshall Scholars NASA STS 62 1994 Mission: USMP-2; OAST-2 Space Shuttle: Columbia Launch Weight: 4,519,319 pounds Launched: March 4, 1994; 8:53:01 a.m. EST Landing Site: Kennedy Space Center, Florida Landing: March 18, 1994 at 8:10 a.m. EST Mission Duration: 13 days, 23 hours, Orbit Altitude: 163 nautical miles Miles Traveled: 5.8 million The Critical Fluid Light Scattering Experiment, or ZENO, science team reported that they expect to locate the critical temperature of xenon at "any time." Team members closely watched computer data traces which indicate their experiment was very near the critical temperature -- the goal of a lengthy, methodical "sensitive" search process. This is a more precise search for the critical temperature after its location has been determined within a narrow band. Once the temperature is located, the team will spend nearly 24 hours taking a good look at the phenomenon they've waited years to see. They will study the properties of xenon at its critical point, taking subtle optical measurements in the region surrounding it. A fluid's "critical point" occurs at a condition of temperature and pressure where the fluid is simultaneously a gas and a liquid. By understanding how matter behaves at the critical point, scientists hope to gain a better insight into a variety of physics problems ranging from phase changes in fluids to changes in the composition and magnetic properties of solids. http://www.nss.org/resources/library/shuttlevideos/shuttle61.htm People who made ZENO possible • Svetlana Avramov, Ratio Transformer Calibration Matt Bieneman, Software Engineer John Borden, Project Manager, POCC Team Hacene Boukari, Sample Cell, POCC Team Matt Briggs, Thermostat, POCC Team Ed Cole, Machinist Glenn Connor, Project Manager Robert Gammon, Principle Investigator, POCC Team David Gent, Sample Cell, POCC Team Sue Landon, Project Coordinator Meade Larson, Product Assurance Paul Mahata, Systems Engineer Don Martin, Technician Lori Mora, Project Coordinator John Pickett, Thermostat Sweathog Jeff Shaumeyer, Project Scientist, POCC Team Mark Sienkiewicz, Software Engineer, POCC Team Danny Swann, Thermostat Sweathog David Torrealba, Project Manager Paul Wood, Machinist Kai-Chang Zhang, Thermostat Flight testing in Boulder Colorado NASA STS 85 1997 Mission: CRISTA-SPAS-02 Space Shuttle: Discovery Launched: August 7, 1997, 10:41:00 a.m. EDT Landing Site: Kennedy Space Center, Florida Landing: August 19, 1997, 7:07:59 a.m. EDT Mission Duration: 11 days, 19 hours, 18 minutes, 47 seconds Orbit Altitude: 173 statute miles Miles Traveled: 4.7 million CVX-2 - Critical Viscosity of Xenon - was a science experiment to measure the viscosity (slipperiness) of Xenon at its critical point (the temperature and pressure where a substance is both a liquid and a gas at the same time.) Here's the very technical status reports the team released during the mission. Imaging Classical Approach PICTURE N samples (ALL measurements are taken) ORTHOGONALIZITION Full set of projections is found SORTING CODING straightforward decoding Only K coefficients K largest coefficients selected are coded N-K coef. dumped K<<N EXAUSTIVE SEARCH Compressive sensing PICTURE CODING Signal Reconstruction Capture only significant components Only M (K ≈ M) samples (measurements) are taken (a) Measurements must be carefully designed (b) Original signal (picture) must be sparse (1) Underdetermined system M<N (2) Reconstructed signal must have N components (3) L1 norm is used to find sparse representation Scene Image Photodiode Bitstream A/D Digital Micromirror Device Array Random Number Generator Reconstruction Major challenges (1) Acquisition speed (2) DSP processing speed The images in (a) and (b) are not meant to be aligned. (a) Conventional digital camera image of a soccer ball (64 × 64=4096 pixels) (b) The same ball recovered from M = 1600 random measurements taken by the camera From IEEE Signal processing magazine July 2007, R. G. Baraniuk, Compressive sensing Experimental results Original 65536 Pixels 3300 Measurements (5%) 16384 Pixels 1600 Measurements (10%) 16384 Pixels 3300 Measurements (20%) 65536 Pixels 1300 Measurements (2%) Sources of noise (1) Nonlinearities in the photodiode (2) Non-uniform reflectance of the mirrors through the lens focus onto the photodiode (changing the weighting of the pattern blocks) (3) Non-uniform mirror positions Robustness of the CS reconstruction algorithm Suppresses quantization noise from ADC and photodiode circuit noise. From D. Takhar at al. A new Compressive Imaging Camera Architecture using Optical domain Compression From IEEE Signal processing magazine July 2007, R. G. Baraniuk, Compressive sensing Definitions x target signal, represenation of an image in time or space domain x is in N dimensional domain x1 11 orthonormal basis xN N 1 1N i othonormal vector NN N i1 iN Classical Approach: Find the signal projections on a given basis : x= si i i 1 sirepresenation of the image in domain iT x x is K-sparce if only K basis vecotors have s 0 (thoeretical) i i x is compressible if it has just a few large s coeficients and many small (practical) i Compressable signals are well represented by K-sparse representations. Compressed sensing: Measure only significant components (M y1 11 y measurements measurement matrix y is in M dimensional domain yM M 1 y=x=s Goal y s 1N MN N) COMPRESSIVE SENSING MEASUREMENT PROCESS Φ y Ψ S = y Θ = M x (a) N K-sparse (b) (a) Compressive sensing measurement process with a random Gaussian measurement matrix and discrete cosine transform (DCT) matrix . The vector of coefficients s is sparse with K = 4. Φ (phi, measurement matrix) Ψ (psi, orthonormal basis) Θ (theta, Compressive Sensing reconstruction matrix) (b) Measurement process with There are four columns that correspond to nonzero si coefficients; the measurement vector y is a linear combination of these columns. From IEEE Signal processing magazine July 2007, R. G. Baraniuk, Compressive sensing S FINDING SOLUTION USING L1 NORM a RN b Ax=b underdetermined system c S (a) The subspaces containing two sparse vectors in R3 lie close to the coordinate axes. (b) Visualization of the L2 minimization (5) that finds the non-sparse point-of-contact s between the 2 ball (hyper-sphere, in red) and the translated measurement matrix null space (in green). (c) Visualization of the L1 minimization solution that finds the sparse point-of-contact s with high probability thanks to the pointiness of the 1 ball. From IEEE Signal processing magazine July 2007, R. G. Baraniuk, Compressive sensing From Imaging via Compressive Sampling J. Romberg L1 AND L2 NORM COMPARISON WHEN FINDING SOLUTION TO COMPRESSIVE SAMPLING PROBLEM (a) A sparse real valued signal and (b) its reconstruction from 60 (complex valued) Fourier coefficients by l1 minimization. The reconstruction is exact. (c) The minimum energy reconstruction obtained by substituting the 1 norm with the l2 norm; l1 and l2 give wildly different answers. The l2 solution does not provide a reasonable approximation to the original signal. From An Introduction to Compressive Sampling E. Candes M. Wakin COMPRESSIVE SENSNING Compressive Imaging Hyperspectral Imaging Medical Imaging Computer Graphics Analog-toInformation Conversion Geophysical Data Analysis Astronomy Biosensing Integrated Circuit Analysis Surface Metrology Communications Spectrum Analysis Random Sampling Remote Sensing Multi-Sensor and Distributed Compressive Sensing Bayesian Methods Statistical Signal Processing Model-based Compressive Sensing Machine Learning Compressive Radar Foundations and Connections Coding and Information Theory High-Dimensional Geometry Finite Rate of Innovation Ell-1 Norm Minimization Compressive Sensing Recovery Algorithms Adaptive Sampling Methods for Sparse Recovery Data Stream Algorithms Heavy-Hitters Dimension Reduction and Embeddings Svetlana Avramov-Zamurović email avramov@usna.edu http://www.usna.edu/Users/weapsys/avramov http://www.dsp.ece.rice.edu/cs http://people.ee.duke.edu/~lcarin/compressive-sensing-workshop.html Sub-Nyquist Sampling From An Introduction to Compressive Sampling E. Candes M. Wakin MRI Application From Sparse MRI: The Application of Compressed Sensing for Rapid MR Imaging M. Lustig, D. Donoho and J. M. Pauly COMPRESSIVE VIDEO SAMPLING Vladimir Stankovic and Lina Stankovic Samuel Cheng • • • • • A system based on the novel concept of compressive sampling to achieve real-time, low complexity acquisition of video. Each frame of the video is split into a number of smaller non-overlapping blocks of equal size to reduce the complexity of compressive sampling algorithms and exploit the varying sparsity across blocks within a frame. Compressive sampling is performed only on those blocks that satisfy our proposed simple sparsity test, while the remaining blocks are sampled fully. Full sampled reference frames are used to predict sparsity of the blocks within successive frames. Experimental results show great potential for compressive sampling for video acquisition, with up to 50% savings in acquisition with good reconstruction quality. Videos and Compressive Sensing
