Tsunami Warning System 1/C Joseph and Professor Avramov-Zamurovic Weapons and Systems Engineering
advertisement
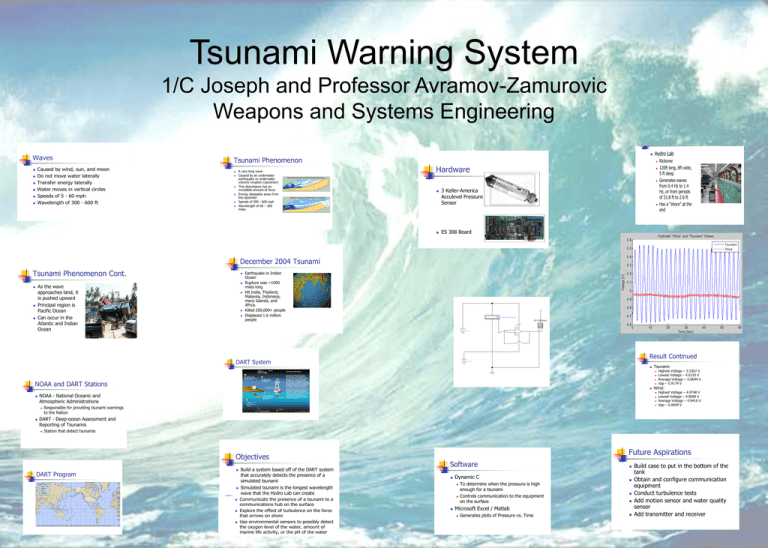
Tsunami Warning System 1/C Joseph and Professor Avramov-Zamurovic Weapons and Systems Engineering Hardware Cont. Waves Caused by wind, sun, and moon Do not move water laterally Transfer energy laterally Water moves in vertical circles Speeds of 5 - 60 mph Wavelength of 300 - 600 ft Tsunami Phenomenon A very long wave Caused by an underwater earthquake or underwater volcanic eruption (epicenter) This disturbance has an incredible amount of force Energy dissipates away from the epicenter Speeds of 500 - 600 mph Wavelength of 60 – 300 miles Hydro Lab Hardware 3 Keller-America Acculevel Pressure Sensor Rickover 120ft long, 8ft wide, 5 ft deep Generates waves from 0.4 Hz to 1.4 Hz, or from periods of 31.8 ft to 2.6 ft Has a “shore” at the end ES 308 Board December 2004 Tsunami Tsunami Phenomenon Cont. As the wave approaches land, it is pushed upward Principal region is Pacific Ocean Can occur in the Atlantic and Indian Ocean Earthquake in Indian Ocean Rupture was ~1000 miles long Hit India, Thailand, Malaysia, Indonesia, many Islands, and Africa. Killed 200,000+ people Displaced 1.6 million people Result Continued DART System Tsunami: NOAA and DART Stations Wind: NOAA - National Oceanic and Atmospheric Administrations Responsible for providing tsunami warnings to the Nation Highest Voltage – 5.5367 V Lowest Voltage – 4.6193 V Average Voltage – 5.0644 V Vpp – 0.9174 V Highest Voltage – 4.9748 V Lowest Voltage – 4.9099 V Average Voltage – 4.9416 V Vpp – 0.0649 V DART - Deep-ocean Assessment and Reporting of Tsunamis Station that detect tsunamis Objectives DART Program Build a system based off of the DART system that accurately detects the presence of a simulated tsunami Simulated tsunami is the longest wavelength Objectives Cont. wave that the Hydro Lab can create Future Aspirations Software Communicate the presence of a tsunami to a communications hub on the surface Explore the effect of turbulence on the force that arrives on shore Use environmental sensors to possibly detect the oxygen level of the water, amount of marine life activity, or the pH of the water Dynamic C To determine when the pressure is high enough for a tsunami Controls communication to the equipment on the surface Microsoft Excel / Matlab Generates plots of Pressure vs. Time Build case to put in the bottom of the tank Obtain and configure communication equipment Conduct turbulence tests Add motion sensor and water quality sensor Add transmitter and receiver
