Introduction Results
advertisement
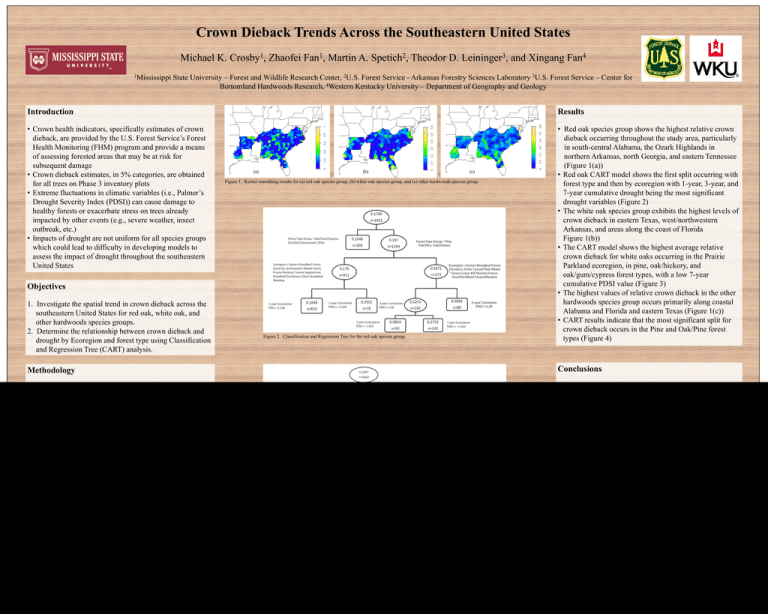
Crown Dieback Trends Across the Southeastern United States Michael K. Crosby1, Zhaofei Fan1, Martin A. Spetich2, Theodor D. Leininger3, and Xingang Fan4 1Mississippi State University – Forest and Wildlife Research Center, 2U.S. Forest Service - Arkansas Forestry Sciences Laboratory 3U.S. Forest Service – Center for Bottomland Hardwoods Research, 4Western Kentucky University – Department of Geography and Geology Introduction Results • Crown health indicators, specifically estimates of crown dieback, are provided by the U.S. Forest Service’s Forest Health Monitoring (FHM) program and provide a means of assessing forested areas that may be at risk for subsequent damage • Crown dieback estimates, in 5% categories, are obtained for all trees on Phase 3 inventory plots • Extreme fluctuations in climatic variables (i.e., Palmer’s Drought Severity Index (PDSI)) can cause damage to healthy forests or exacerbate stress on trees already impacted by other events (e.g., severe weather, insect outbreak, etc.) • Impacts of drought are not uniform for all species groups which could lead to difficulty in developing models to assess the impact of drought throughout the southeastern United States • Red oak species group shows the highest relative crown dieback occurring throughout the study area, particularly in south-central Alabama, the Ozark Highlands in northern Arkansas, north Georgia, and eastern Tennessee (Figure 1(a)) • Red oak CART model shows the first split occurring with forest type and then by ecoregion with 1-year, 3-year, and 7-year cumulative drought being the most significant drought variables (Figure 2) • The white oak species group exhibits the highest levels of crown dieback in eastern Texas, west/northwestern Arkansas, and areas along the coast of Florida Figure 1(b)) • The CART model shows the highest average relative crown dieback for white oaks occurring in the Prairie Parkland ecoregion, in pine, oak/hickory, and oak/gum/cypress forest types, with a low 7-year cumulative PDSI value (Figure 3) • The highest values of relative crown dieback in the other hardwoods species group occurs primarily along coastal Alabama and Florida and eastern Texas (Figure 1(c)) • CART results indicate that the most significant split for crown dieback occurs in the Pine and Oak/Pine forest types (Figure 4) (a) (b) Figure 1. Kernel smoothing results for (a) red oak species group, (b) white oak species group, and (c) other hardwoods species group. Objectives 1. Investigate the spatial trend in crown dieback across the southeastern United States for red oak, white oak, and other hardwoods species groups. 2. Determine the relationship between crown dieback and drought by Ecoregion and forest type using Classification and Regression Tree (CART) analysis. (c) Figure 2. Classification and Regression Tree for the red oak species group. Methodology Conclusions • Obtained Phase 3 FIA/FHM data for 10 states in the southeastern U.S. (Alabama, Arkansas, Florida, Georgia, Kentucky, North Carolina, South Carolina, Tennessee, Texas, and Virginia) for the years 2002-2010 • Obtained PDSI data from the National Climate Data Center (NCDC) and calculated cumulative growing season PDSI (March-September) for a 10 year period prior to inventory years • Used ArcGIS to extract annual growing season PDSI and Ecoregion to each FHM plot • Determined relative crown dieback for each species group by calculating an Relative Crown Dieback variable which removes variations due to stand and site factors: • Spatially, all species groups show elevated levels of crown dieback occurring along coastal sections of Alabama and Florida and areas of eastern Texas possibly owing to prolonged drought or storm damage (with secondary impacts from insects) • CART results indicate that drought plays a role in higher levels of crown dieback as well as classification by ecoregion and/or forest type • These preliminary results can be utilized to develop hierarchical models to assess the current future impacts of climate change scenarios based on downscaled climate data Figure 3. Classification and Regression Tree for the white oak species group. Average Crown Dieback for Species Group x i Relative Crown Dieback = Total Crown Dieback for all Species Groups • Used Kernel Density to determine spatial trends for each species group across the selected states • Developed CART models for each species group that split the data into homogenous groups based on forest type, ecoregion, and cumulative growing season PDSI values Acknowledgement This project was funded by the U.S. Forest Service Forest Health Monitoring Program (# SO-EM-F-10-01) and NASA through a subcontract- WKU5162201000110070670 from Western Kentucky University. Figure 4. Classification and Regression Tree for the other hardwoods species group. Contact Info: Michael K. Crosby (mkc34@msstate.edu) (662) 325-1527
