California’s High-elevation White Pines: Beetle Evidence, Cone Production, and Regeneration Background
advertisement

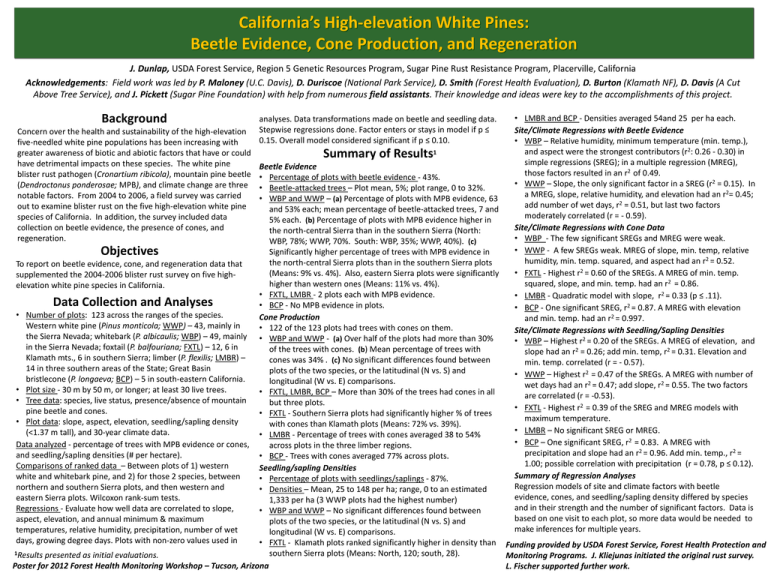
California’s High-elevation White Pines: Beetle Evidence, Cone Production, and Regeneration J. Dunlap, USDA Forest Service, Region 5 Genetic Resources Program, Sugar Pine Rust Resistance Program, Placerville, California Acknowledgements: Field work was led by P. Maloney (U.C. Davis), D. Duriscoe (National Park Service), D. Smith (Forest Health Evaluation), D. Burton (Klamath NF), D. Davis (A Cut Above Tree Service), and J. Pickett (Sugar Pine Foundation) with help from numerous field assistants. Their knowledge and ideas were key to the accomplishments of this project. Background Concern over the health and sustainability of the high-elevation five-needled white pine populations has been increasing with greater awareness of biotic and abiotic factors that have or could have detrimental impacts on these species. The white pine blister rust pathogen (Cronartium ribicola), mountain pine beetle (Dendroctonus ponderosae; MPB), and climate change are three notable factors. From 2004 to 2006, a field survey was carried out to examine blister rust on the five high-elevation white pine species of California. In addition, the survey included data collection on beetle evidence, the presence of cones, and regeneration. analyses. Data transformations made on beetle and seedling data. Stepwise regressions done. Factor enters or stays in model if p ≤ 0.15. Overall model considered significant if p ≤ 0.10. Summary of Results 1 • LMBR and BCP - Densities averaged 54and 25 per ha each. Site/Climate Regressions with Beetle Evidence • WBP – Relative humidity, minimum temperature (min. temp.), and aspect were the strongest contributors (r2: 0.26 - 0.30) in simple regressions (SREG); in a multiple regression (MREG), those factors resulted in an r2 of 0.49. • WWP – Slope, the only significant factor in a SREG (r2 = 0.15). In a MREG, slope, relative humidity, and elevation had an r2= 0.45; add number of wet days, r2 = 0.51, but last two factors moderately correlated (r = - 0.59). Site/Climate Regressions with Cone Data • WBP - The few significant SREGs and MREG were weak. • WWP - A few SREGs weak. MREG of slope, min. temp, relative humidity, min. temp. squared, and aspect had an r2 = 0.52. • FXTL - Highest r2 = 0.60 of the SREGs. A MREG of min. temp. squared, slope, and min. temp. had an r2 = 0.86. • LMBR - Quadratic model with slope, r2 = 0.33 (p ≤ .11). • BCP - One significant SREG, r2 = 0.87. A MREG with elevation and min. temp. had an r2 = 0.997. Site/Climate Regressions with Seedling/Sapling Densities • WBP – Highest r2 = 0.20 of the SREGs. A MREG of elevation, and slope had an r2 = 0.26; add min. temp, r2 = 0.31. Elevation and min. temp. correlated (r = - 0.57). • WWP – Highest r2 = 0.47 of the SREGs. A MREG with number of wet days had an r2 = 0.47; add slope, r2 = 0.55. The two factors are correlated (r = -0.53). • FXTL - Highest r2 = 0.39 of the SREG and MREG models with maximum temperature. • LMBR – No significant SREG or MREG. • BCP – One significant SREG, r2 = 0.83. A MREG with precipitation and slope had an r2 = 0.96. Add min. temp., r2 = 1.00; possible correlation with precipitation (r = 0.78, p ≤ 0.12). Summary of Regression Analyses Regression models of site and climate factors with beetle evidence, cones, and seedling/sapling density differed by species and in their strength and the number of significant factors. Data is based on one visit to each plot, so more data would be needed to make inferences for multiple years. Beetle Evidence • Percentage of plots with beetle evidence - 43%. • Beetle-attacked trees – Plot mean, 5%; plot range, 0 to 32%. • WBP and WWP – (a) Percentage of plots with MPB evidence, 63 and 53% each; mean percentage of beetle-attacked trees, 7 and 5% each. (b) Percentage of plots with MPB evidence higher in the north-central Sierra than in the southern Sierra (North: WBP, 78%; WWP, 70%. South: WBP, 35%; WWP, 40%). (c) Significantly higher percentage of trees with MPB evidence in Objectives the north-central Sierra plots than in the southern Sierra plots To report on beetle evidence, cone, and regeneration data that (Means: 9% vs. 4%). Also, eastern Sierra plots were significantly supplemented the 2004-2006 blister rust survey on five highhigher than western ones (Means: 11% vs. 4%). elevation white pine species in California. • FXTL, LMBR - 2 plots each with MPB evidence. Data Collection and Analyses • BCP - No MPB evidence in plots. • Number of plots: 123 across the ranges of the species. Cone Production Western white pine (Pinus monticola; WWP) – 43, mainly in • 122 of the 123 plots had trees with cones on them. the Sierra Nevada; whitebark (P. albicaulis; WBP) – 49, mainly • WBP and WWP - (a) Over half of the plots had more than 30% in the Sierra Nevada; foxtail (P. balfouriana; FXTL) – 12, 6 in of the trees with cones. (b) Mean percentage of trees with Klamath mts., 6 in southern Sierra; limber (P. flexilis; LMBR) – cones was 34% . (c) No significant differences found between 14 in three southern areas of the State; Great Basin plots of the two species, or the latitudinal (N vs. S) and bristlecone (P. longaeva; BCP) – 5 in south-eastern California. longitudinal (W vs. E) comparisons. • Plot size - 30 m by 50 m, or longer; at least 30 live trees. • FXTL, LMBR, BCP – More than 30% of the trees had cones in all • Tree data: species, live status, presence/absence of mountain but three plots. pine beetle and cones. • FXTL - Southern Sierra plots had significantly higher % of trees • Plot data: slope, aspect, elevation, seedling/sapling density with cones than Klamath plots (Means: 72% vs. 39%). (<1.37 m tall), and 30-year climate data. • LMBR - Percentage of trees with cones averaged 38 to 54% Data analyzed - percentage of trees with MPB evidence or cones, across plots in the three limber regions. and seedling/sapling densities (# per hectare). • BCP - Trees with cones averaged 77% across plots. Comparisons of ranked data – Between plots of 1) western Seedling/sapling Densities white and whitebark pine, and 2) for those 2 species, between • Percentage of plots with seedlings/saplings - 87%. northern and southern Sierra plots, and then western and • Densities – Mean, 25 to 148 per ha; range, 0 to an estimated eastern Sierra plots. Wilcoxon rank-sum tests. 1,333 per ha (3 WWP plots had the highest number) Regressions - Evaluate how well data are correlated to slope, • WBP and WWP – No significant differences found between aspect, elevation, and annual minimum & maximum plots of the two species, or the latitudinal (N vs. S) and temperatures, relative humidity, precipitation, number of wet longitudinal (W vs. E) comparisons. days, growing degree days. Plots with non-zero values used in • FXTL - Klamath plots ranked significantly higher in density than Funding provided by USDA Forest Service, Forest Health Protection and 1Results presented as initial evaluations. southern Sierra plots (Means: North, 120; south, 28). Monitoring Programs. J. Kliejunas initiated the original rust survey. Poster for 2012 Forest Health Monitoring Workshop – Tucson, Arizona L. Fischer supported further work.


