An Assessment of Hawaiian Dry Forest Condition
advertisement

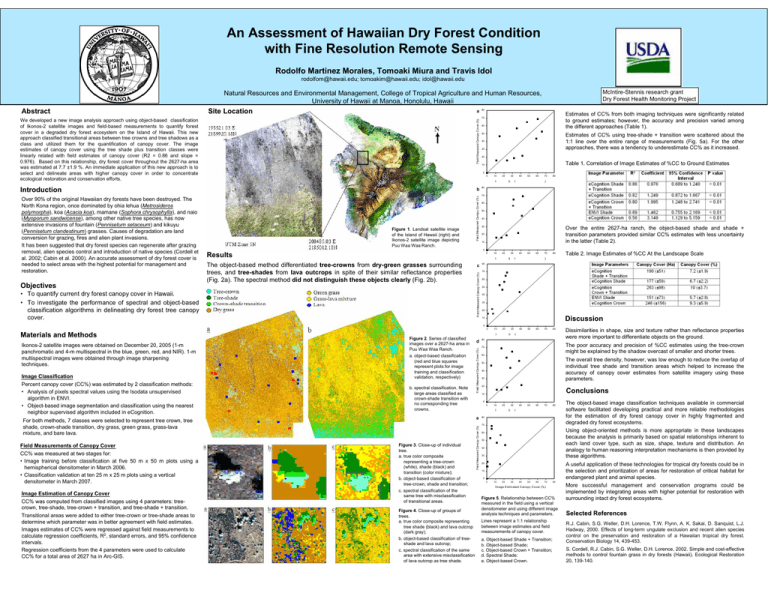
An Assessment of Hawaiian Dry Forest Condition with Fine Resolution Remote Sensing Rodolfo Martinez Morales, Tomoaki Miura and Travis Idol rodolfom@hawaii.edu; tomoakim@hawaii.edu; idol@hawaii.edu McIntire-Stennis research grant Dry Forest Health Monitoring Project Natural Resources and Environmental Management, College of Tropical Agriculture and Human Resources, University of Hawaii at Manoa, Honolulu, Hawaii Site Location a Field Measured Canopy Cover (%) Abstract We developed a new image analysis approach using object-based classification of Ikonos-2 satellite images and field-based measurements to quantify forest cover in a degraded dry forest ecosystem on the Island of Hawaii. This new approach classified transitional areas between tree crowns and tree shadows as a class and utilized them for the quantification of canopy cover. The image estimates of canopy cover using the tree shade plus transition classes were linearly related with field estimates of canopy cover (R2 = 0.86 and slope = 0.976). Based on this relationship, dry forest cover throughout the 2627-ha area was estimated at 7.7 ±1.9 %. An immediate application of this new approach is to select and delineate areas with higher canopy cover in order to concentrate ecological restoration and conservation efforts. Introduction b Objectives Estimates of CC% from both imaging techniques were significantly related to ground estimates; however, the accuracy and precision varied among the different approaches (Table 1). 70 60 50 Estimates of CC% using tree-shade + transition were scattered about the 1:1 line over the entire range of measurements (Fig. 5a). For the other approaches, there was a tendency to underestimate CC% as it increased. 40 30 20 Table 1. Correlation of Image Estimates of %CC to Ground Estimates 10 0 0 10 20 30 40 50 60 70 80 Figure 1. Landsat satellite image of the Island of Hawaii (right) and Ikonos-2 satellite image depicting Puu Waa Waa Ranch. Field Measured Canopy Cover (%) Image Es tima ted Canopy Cover (% ) 80 70 60 50 40 30 Over the entire 2627-ha ranch, the object-based shade and shade + transition parameters provided similar CC% estimates with less uncertainty in the latter (Table 2). 20 10 0 Results 0 10 20 30 40 50 60 70 80 Table 2. Image Estimates of %CC At the Landscape Scale Image Es tima ted Canopy Cover (% ) The object-based method differentiated tree-crowns from dry-green grasses surrounding trees, and tree-shades from lava outcrops in spite of their similar reflectance properties (Fig. 2a). The spectral method did not distinguish these objects clearly (Fig. 2b). • To quantify current dry forest canopy cover in Hawaii. • To investigate the performance of spectral and object-based classification algorithms in delineating dry forest tree canopy cover. c Field Measured Canopy Cover (%) Over 90% of the original Hawaiian dry forests have been destroyed. The North Kona region, once dominated by ohia lehua (Metrosideros polymorpha), koa (Acacia koa), mamane (Sophora chrysophylla), and naio (Myoporum sandwicense), among other native tree species, has now extensive invasions of fountain (Pennisetum setaceum) and kikuyu (Pennisetum clandestinum) grasses. Causes of degradation are land conversion for grazing, fires and alien plant invasions. It has been suggested that dry forest species can regenerate after grazing removal, alien species control and introduction of native species (Cordell et al. 2002; Cabin et al. 2000). An accurate assessment of dry forest cover is needed to select areas with the highest potential for management and restoration. 80 80 70 60 50 40 30 20 Discussion 10 0 0 Image Classification Percent canopy cover (CC%) was estimated by 2 classification methods: • Analysis of pixels spectral values using the Isodata unsupervised algorithm in ENVI. • Object-based image segmentation and classification using the nearest neighbor supervised algorithm included in eCognition. a. object-based classification (red and blue squares represent plots for image training and classification validation, respectively) b. spectral classification. Note large areas classified as crown-shade transition with no corresponding tree crowns. Image Estimation of Canopy Cover CC% was computed from classified images using 4 parameters: treecrown, tree-shade, tree-crown + transition, and tree-shade + transition. Transitional areas were added to either tree-crown or tree-shade areas to determine which parameter was in better agreement with field estimates. Images estimates of CC% were regressed against field measurements to calculate regression coefficients, R2, standard errors, and 95% confidence intervals. Regression coefficients from the 4 parameters were used to calculate CC% for a total area of 2627 ha in Arc-GIS. 30 40 50 60 70 80 Figure 3. Close-up of individual tree. a. true color composite representing a tree-crown (white), shade (black) and transition (color mixture); b. object-based classification of tree-crown, shade and transition; c. spectral classification of the same tree with misclassification of transitional areas. Figure 4. Close-up of groups of trees. a. true color composite representing tree shade (black) and lava outcrop (dark gray); b. object-based classification of treeshade and lava outcrop; c. spectral classification of the same area with extensive misclassification of lava outcrop as tree shade. 80 Dissimilarities in shape, size and texture rather than reflectance properties were more important to differentiate objects on the ground. The poor accuracy and precision of %CC estimates using the tree-crown might be explained by the shadow overcast of smaller and shorter trees. 70 60 The overall tree density, however, was low enough to reduce the overlap of individual tree shade and transition areas which helped to increase the accuracy of canopy cover estimates from satellite imagery using these parameters. 50 40 30 20 Conclusions 10 0 0 10 20 30 40 50 60 70 80 Image Es tima ted Canopy Cover (%) e For both methods, 7 classes were selected to represent tree crown, tree shade, crown-shade transition, dry grass, green grass, grass-lava mixture, and bare lava. Field Measurements of Canopy Cover CC% was measured at two stages for: • Image training before classification at five 50 m x 50 m plots using a hemispherical densitometer in March 2006. • Classification validation at ten 25 m x 25 m plots using a vertical densitometer in March 2007. d Field Measured Canopy Cover (%) Ikonos-2 satellite images were obtained on December 20, 2005 (1-m panchromatic and 4-m multispectral in the blue, green, red, and NIR). 1-m multispectral images were obtained through image sharpening techniques. 20 Image Es tima ted Canopy Cover (%) Figure 2. Series of classified images over a 2627-ha area in Puu Waa Waa Ranch. Field Measured Canopy Cover (%) Materials and Methods 10 80 70 The object-based image classification techniques available in commercial software facilitated developing practical and more reliable methodologies for the estimation of dry forest canopy cover in highly fragmented and degraded dry forest ecosystems. Using object-oriented methods is more appropriate in these landscapes because the analysis is primarily based on spatial relationships inherent to each land cover type, such as size, shape, texture and distribution. An analogy to human reasoning interpretation mechanisms is then provided by these algorithms. 60 50 40 30 20 A useful application of these technologies for tropical dry forests could be in the selection and prioritization of areas for restoration of critical habitat for endangered plant and animal species. 10 0 0 10 20 30 40 50 60 70 80 Im age Estim ated Canopy Cover (%) Figure 5. Relationship between CC% measured in the field using a vertical densitometer and using different image analysis techniques and parameters. Lines represent a 1:1 relationship between image estimates and field measurements of canopy cover. a. Object-based Shade + Transition; b. Object-based Shade; c. Object-based Crown + Transition; d. Spectral Shade; e. Object-based Crown. More successful management and conservation programs could be implemented by integrating areas with higher potential for restoration with surrounding intact dry forest ecosystems. Selected References R.J. Cabin, S.G. Weller, D.H. Lorence, T.W. Flynn, A. K. Sakai, D. Sanquist, L.J. Hadway, 2000. Effects of long-term ungulate exclusion and recent alien species control on the preservation and restoration of a Hawaiian tropical dry forest. Conservation Biology 14, 439-453. S. Cordell, R.J. Cabin, S.G. Weller, D.H. Lorence, 2002. Simple and cost-effective methods to control fountain grass in dry forests (Hawaii). Ecological Restoration 20, 139-140.


