Relationship of an Indicator of Lichen Species Richness to Air... Climate Variables Across the United States
advertisement
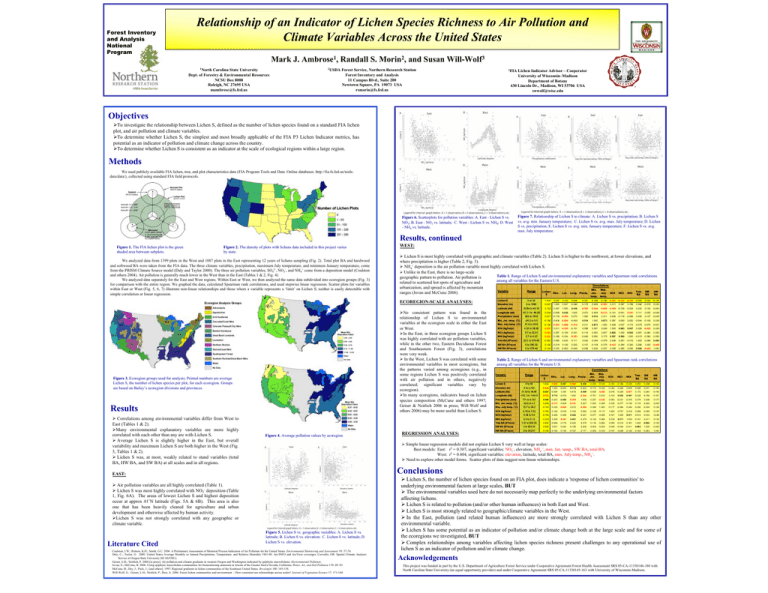
Forest Inventory and Analysis National Program Relationship of an Indicator of Lichen Species Richness to Air Pollution and Climate Variables Across the United States Mark J. Ambrose1, Randall S. Morin2, and Susan Will-Wolf3 1North Carolina State University Dept. of Forestry & Environmental Resources NCSU Box 8008 Raleigh, NC 27695 USA mambrose@fs.fed.us 2USDA Forest Service, Northern Research Station Forest Inventory and Analysis 11 Campus Blvd., Suite 200 Newtown Square, PA 19073 USA rsmorin@fs.fed.us 3FIA Lichen Indicator Advisor – Cooperator University of Wisconsin–Madison Department of Botany 430 Lincoln Dr., Madison, WI 53706 USA swwolf@wisc.edu Objectives ¾To investigate the relationship between Lichen S, defined as the number of lichen species found on a standard FIA lichen plot, and air pollution and climate variables. ¾To determine whether Lichen S, the simplest and most broadly applicable of the FIA P3 Lichen Indicator metrics, has potential as an indicator of pollution and climate change across the country. ¾To determine whether Lichen S is consistent as an indicator at the scale of ecological regions within a large region. Methods We used publicly available FIA lichen, tree, and plot characteristics data (FIA Program Tools and Data. Online databases. http://fia.fs.fed.us/toolsdata/data/), collected using standard FIA field protocols. Figure 6. Scatterplots for pollution variables: A. East - Lichen S vs. NO3; B. East - NO3 vs. latitude; C. West - Lichen S vs. NH4; D. West - NH4 vs. latitude. Figure 7. Relationship of Lichen S to climate: A. Lichen S vs. precipitation; B. Lichen S vs. avg. min. January temperature; C. Lichen S vs. avg. max. July temperature; D. Lichen S vs. precipitation; E. Lichen S vs. avg. min. January temperature; F. Lichen S vs. avg. max. July temperature. Results, continued Figure 1. The FIA lichen plot is the green shaded area between subplots. Figure 2. The density of plots with lichens data included in this project varies by state. We analyzed data from 1399 plots in the West and 1087 plots in the East representing 12 years of lichens sampling (Fig. 2). Total plot BA and hardwood and softwood BA were taken from the FIA data. The three climate variables, precipitation, maximum July temperature, and minimum January temperature, come from the PRISM Climate Source model (Daly and Taylor 2000). The three air pollution variables, SO42-, NO3-, and NH4+ come from a deposition model (Coulston and others 2004). Air pollution is generally much lower in the West than in the East (Tables 1 & 2, Fig. 4). We analyzed data separately for the East and West regions. Within East or West, we then analyzed the same data subdivided into ecoregion groups (Fig. 3) for comparison with the entire region. We graphed the data, calculated Spearman rank correlations, and used stepwise linear regression. Scatter plots for variables within East or West (Fig. 5, 6, 7) illustrate non-linear relationships and those where a variable represents a ‘limit’ on Lichen S; neither is easily detectable with simple correlation or linear regression. WEST: ¾ Lichen S is most highly correlated with geographic and climate variables (Table 2). Lichen S is higher to the northwest, at lower elevations, and where precipitation is higher (Table 2, Fig. 3). ¾ NH4+ deposition is the air pollution variable most highly correlated with Lichen S. ¾ Unlike in the East, there is no large-scale Table 1. Range of Lichen S and environmental explanatory variables and Spearman rank correlations geographic pattern to pollution. Air pollution is among all variables for the Eastern U.S. related to scattered hot spots of agriculture and Correlations urbanization, and spread is affected by mountain Min. Max. Variable Range Lichen Tree SW HW Elev. Lat. Long. Precip. Jan. ranges (Jovan and McCune 2006). July SO4 NO3 NH4 S BA BA BA temp. ECOREGION-SCALE ANALYSES: ¾No consistent pattern was found in the relationship of Lichen S to environmental variables at the ecoregion scale in either the East or West. ¾In the East, in three ecoregion groups Lichen S was highly correlated with air pollution variables, while in the other two, Eastern Deciduous Forest and Southeastern Forest (Fig. 3), correlations were very weak. ¾ In the West, Lichen S was correlated with some environmental variables in most ecoregions, but the patterns varied among ecoregions (e.g., in some regions Lichen S was positively correlated with air pollution and in others, negatively correlated; significant variables vary by ecoregion). ¾In many ecoregions, indicators based on lichen species composition (McCune and others 1997; Geiser & Neitlich 2006 in press; Will-Wolf and others 2006) may be more useful than Lichen S. Figure 3. Ecoregion groups used for analysis. Printed numbers are average Lichen S, the number of lichen species per plot, for each ecoregion. Groups are based on Bailey’s ecoregion divisions and provinces. Results ¾ Correlations among environmental variables differ from West to East (Tables 1 & 2). ¾Many environmental explanatory variables are more highly correlated with each other than any are with Lichen S. ¾ Average Lichen S is slightly higher in the East, but overall variability and maximum Lichen S are both higher in the West (Fig. 3, Tables 1 & 2). ¾ Lichen S was, at most, weakly related to stand variables (total BA, HW BA, and SW BA) at all scales and in all regions. Figure 4. Average pollution values by ecoregion. temp. 0 to 33 1.000 0.097 0.152 0.044 0.021 -0.186 -0.190 -0.387 -0.463 -0.363 -0.052 Elevation (m) 0 to 1660 0.097 1.000 0.247 -0.088 -0.178 -0.406 -0.553 Latitude (dd) 30.64 to 49.18 0.152 0.247 1.000 0.436 -0.554 -0.966 -0.828 -0.439 -0.129 -0.034 0.032 0.126 -0.063 0.044 -0.088 0.436 1.000 0.070 -0.409 -0.513 -0.101 -0.001 -0.553 0.111 0.225 -0.048 483 to 1919 0.021 -0.178 -0.554 0.070 1.000 0.514 0.311 0.058 -0.119 -0.426 0.032 0.107 -0.039 Longitude (dd) -67.11 to -96.95 Precipitation (mm) Min. Jan. temp. (˚C) 0.211 0.297 0.186 0.166 -0.124 0.066 -0.218 0.230 -24.3 to 5.0 -0.186 -0.406 -0.966 -0.409 0.514 1.000 0.873 0.397 0.093 0.050 -0.044 -0.109 Max. July temp. (˚C) 21.9 to 33.9 -0.190 -0.553 -0.828 -0.513 0.311 0.873 1.000 0.248 0.007 0.172 -0.079 -0.079 -0.027 SO4 (kg/ha/yr) 4.32 to 28.98 -0.387 0.211 -0.439 -0.101 0.058 0.397 0.248 1.000 0.883 0.507 0.028 -0.422 0.329 5.7 to 22.51 NO3 (kg/ha/yr) -0.463 0.297 -0.129 -0.001 -0.119 0.007 0.883 1.000 0.593 0.081 -0.384 0.350 0.7 to 4.32 -0.363 0.186 -0.034 -0.553 -0.426 0.050 0.172 0.507 0.593 1.000 -0.015 -0.383 0.250 Tree BA (ft²/acre) 22.1 to 579.49 -0.052 0.066 0.032 0.111 0.032 -0.044 -0.079 0.028 0.081 -0.015 1.000 0.266 SW BA (ft²/acre) 0 to 290.30 0.166 -0.218 0.126 0.225 0.107 -0.109 -0.079 -0.422 -0.384 -0.383 0.266 1.000 -0.498 HW BA (ft²/acre) 0 to 579.49 0.230 -0.063 -0.048 -0.039 0.039 -0.027 0.584 -0.498 NH4 (kg/ha/yr) -0.124 0.093 0.039 0.329 0.350 0.250 0.584 1.000 Table 2. Range of Lichen S and environmental explanatory variables and Spearman rank correlations among all variables for the Western U.S. Correlations Long. Precip. Min. Jan. temp. Max. July temp. NO3 NH4 Tree BA SW BA 0.487 -0.485 0.490 0.358 -0.140 0.152 -0.196 -0.329 0.255 0.208 0.155 -0.400 0.714 -0.303 -0.773 -0.335 -0.162 0.326 0.209 -0.069 0.001 -0.190 -0.400 1.000 -0.418 0.499 0.009 -0.488 0.018 -0.329 -0.497 0.175 0.244 -0.190 0.714 -0.418 1.000 -0.560 -0.751 0.012 0.132 0.552 0.441 -0.222 -0.156 -0.167 -0.522 Variable Range Lichen S Elev. Lat. Lichen S 0 to 45 1.000 -0.528 0 to 3,740 -0.528 1.000 31.42 to 48.96 0.487 -103.1 to -124.41 -0.485 Elevation (m) Latitude (dd) Longitude (dd) Precipitation (mm) 171 to 4,731 SO4 HW BA 0.490 -0.303 0.499 -0.560 1.000 0.327 0.093 -0.231 -0.379 0.379 0.306 0.177 Min. Jan. temp. (˚C) -22.6 to 4.7 0.358 -0.773 0.009 -0.751 0.327 1.000 0.349 0.105 -0.277 -0.134 0.116 -0.003 0.305 Max. July temp. (˚C) 15.7 to 38.3 -0.140 -0.335 -0.488 0.012 -0.522 0.349 1.000 -0.117 -0.066 0.346 -0.260 -0.304 0.124 SO4 (kg/ha/yr) 0.18 to 7.53 0.152 -0.162 0.018 0.132 0.093 0.105 -0.117 1.000 0.727 0.218 0.099 0.049 0.147 NO3 (kg/ha/yr) 0.38 to 5.9 -0.196 0.326 -0.329 0.552 -0.231 -0.277 -0.066 0.727 1.000 0.571 -0.014 -0.034 NH4 (kg/ha/yr) 0.0 to 2.14 -0.329 0.209 -0.497 0.441 -0.379 -0.134 0.346 0.218 0.571 1.000 -0.161 -0.211 Tree BA (ft²/acre) 1.51 to 650.24 0.255 -0.069 0.175 -0.222 0.379 0.116 -0.260 0.099 -0.014 -0.161 1.000 0.893 0.102 SW BA (ft²/acre) 0 to 650.24 0.208 0.001 0.244 -0.156 0.306 -0.003 -0.304 0.049 -0.034 -0.211 0.893 1.000 -0.243 HW BA (ft²/acre) 0 to 242.67 0.155 -0.190 -0.190 -0.167 0.177 0.305 0.124 0.147 0.048 0.132 0.102 -0.243 1.000 0.048 0.132 ¾ Simple linear regression models did not explain Lichen S very well at large scales: Best models: East: r2 = 0.307, significant variables: NO3-, elevation, NH4 +, min. Jan. temp., SW BA, total BA. West: r2 = 0.404, significant variables: elevation, latitude, total BA, max. July temp., NH4+. ¾ Need to explore other model forms. Scatter plots of data suggest non-linear relationships. Conclusions EAST: ¾ Air pollution variables are all highly correlated (Table 1). ¾ Lichen S was most highly correlated with NO3- deposition (Table 1, Fig. 6A). The areas of lowest Lichen S and highest deposition occur at approx 41˚N latitude (Figs. 5A & 6B). This area is also one that has been heavily cleared for agriculture and urban development and otherwise affected by human activity. ¾Lichen S was not strongly correlated with any geographic or climate variable. Literature Cited REGRESSION ANALYSES: Lichen S Figure 5. Lichen S vs. geographic variables: A. Lichen S vs. latitude; B. Lichen S vs. elevation; C. Lichen S vs. latitude; D. Lichen S vs. elevation. Coulston, J.W.; Riitters, K.H.; Smith, G.C. 2004. A Preliminary Assessment of Montreal Process Indicators of Air Pollution for the United States. Environmental Monitoring and Assessment. 95: 57-74. Daly, C.; Taylor, G. 2000. United States Average Monthly or Annual Precipitation, Temperature, and Relative Humidity 1961-90. Arc/INFO and ArcView coverages. Corvallis, OR: Spatial Climate Analysis Service at Oregon State University (SCAS/OSU). Geiser, L.H.; Neitlich, P. 2006 [in press]. Air pollution and climate gradients in western Oregon and Washington indicated by epiphytic macrolichens. Environmental Pollution. Jovan, S.; McCune, B. 2006. Using epiphytic macrolichen communities for biomonitoring ammonia in forests of the Greater Sierra Nevada, California. Water, Air, and Soil Pollution 170: 69–93. McCune, B.; Dey, J.; Peck, J.; [and others]. 1997. Regional gradients in lichen communities of the Southeast United States. Bryologist 100: 145-158. Will-Wolf, S.; Geiser, L.H.; Neitlich, P.; Reis, A. 2006. Forest lichen communities and environment - How consistent are relationships across scales? Journal of Vegetation Science 17: 171-184. ¾ Lichen S, the number of lichen species found on an FIA plot, does indicate a 'response of lichen communities' to underlying environmental factors at large scales, BUT ¾ The environmental variables used here do not necessarily map perfectly to the underlying environmental factors affecting lichens. ¾ Lichen S is related to pollution (and/or other human influences) in both East and West. ¾ Lichen S is most strongly related to geographic/climate variables in the West. ¾ In the East, pollution (and related human influences) are more strongly correlated with Lichen S than any other environmental variable. ¾ Lichen S has some potential as an indicator of pollution and/or climate change both at the large scale and for some of the ecoregions we investigated, BUT ¾ Complex relationships among variables affecting lichen species richness present challenges to any operational use of lichen S as an indicator of pollution and/or climate change. Acknowledgements This project was funded in part by the U.S. Department of Agriculture Forest Service under Cooperative Agreement Forest Health Assessment SRS 05-CA-11330146-180 with North Carolina State University (an equal opportunity provider) and under Cooperative Agreement SRS 05-CA-11330145-163 with University of Wisconsin-Madison.

