Document 11089765
advertisement
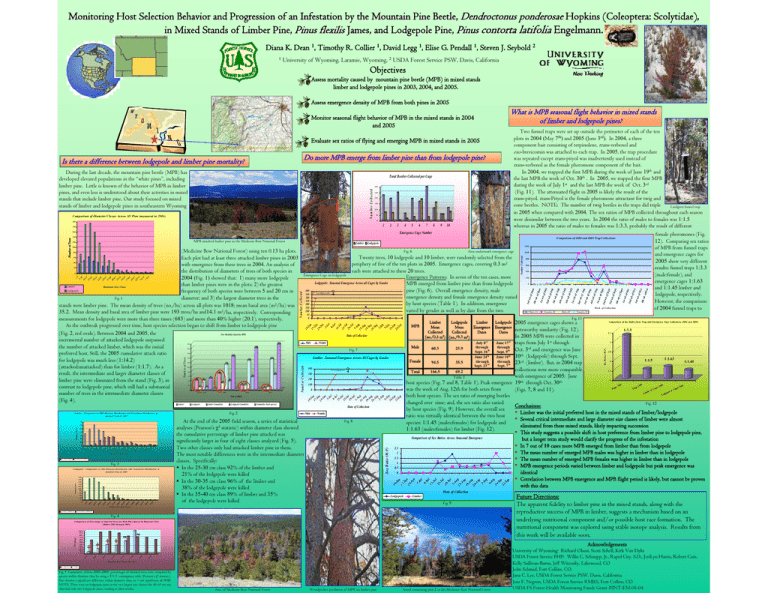
Monitoring Host Selection Behavior and Progression of an Infestation Infestation by the Mountain Pine Beetle, Dendroctonus ponderosae Hopkins (Coleoptera (Coleoptera:: Scolytidae), Scolytidae), in Mixed Stands of Limber Pine, Pinus flexilis James, and Lodgepole Pine, Pinus contorta latifolia Engelmann. Diana K. Dean 1, Timothy R. Collier 1, David Legg 1, Elise G. Pendall 1, Steven J. Seybold 2 1 University of Wyoming, Laramie, Wyoming, 2 USDA Forest Service PSW, Davis, California Objectives Assess mortality caused by mountain pine beetle (MPB) in mixed stands limber and lodgepole pines in 2003, 2004, and 2005. Assess emergence density of MPB from both pines in 2005 Monitor seasonal flight behavior of MPB in the mixed stands in 2004 and 2005 What is MPB seasonal flight behavior in mixed stands of limber and lodgepole pines? Two funnel traps were set up outside the perimeter of each of the ten plots in 2004 (May 7th) and 2005 (June 3rd). In 2004, a three component bait consisting of terpinolene, trans-verbenol and exo-brevicomin was attached to each trap. In 2005, the trap procedure Do more MPB emerge from limber pine than from lodgepole pine? was repeated except trans-pityol was inadvertently used instead of Is there a difference between lodgepole and limber pine mortality? trans-verbenol as the female pheromone component of the bait. In 2004, we trapped the first MPB during the week of June 19th and During the last decade, the mountain pine beetle (MPB) has Total Beetles Collected per Cage the last MPB the week of Oct. 30th . In 2005, we trapped the first MPB developed elevated populations in the “white pines”, including during the week of July 1st and the last MPB the week of Oct. 3rd limber pine. Little is known of the behavior of MPB in limber (Fig. 11). The attenuated flight in 2005 is likely the result of the pines, and even less is understood about their activities in mixed trans-pityol. trans-Pityol is the female pheromone attractant for twig and stands that include limber pine. Our study focused on mixed cone beetles. NOTE: The number of twig beetles in the traps did triple stands of limber and lodgepole pines in southeastern Wyoming Lindgren funnel trap in 2005 when compared with 2004. The sex ratios of MPB collected throughout each season Comparison of Diameter Classes Across All Plots (measured in 2004) were dissimilar between the two years. In 2004 the ratio of males to females was 1:1.5 1 2 3 4 5 6 7 8 9 10 whereas in 2005 the ratio of males to females was 1:3.3, probably the result of different Emergence Cage Number female pheromones (Fig. Comparison of 2004 and 2005 Trap Collections MPB attacked limber pine in the Medicine Bow National Forest 12). Comparing sex ratios Limber Lodgepole of MPB from funnel traps Area underneath emergence cage Fig. 6 (Medicine Bow National Forest) using ten 0.13 ha plots. and emergence cages for Twenty trees, 10 lodgepole and 10 limber, were randomly selected from the Each plot had at least three attacked limber pines in 2003 2005 show very different periphery of five of the ten plots in 2005. Emergence cages, covering 0.3 m2 with emergence from these trees in 2004. An analysis of results: funnel traps 1:3.3 each were attached to these 20 trees. the distribution of diameters of trees of both species in (male:female), and Emergence Cage on lodgepole Emergence Patterns: In seven of the ten cases, more 2004 (Fig. 1) showed that: 1) many more lodgepole emergence cages 1:1.63 Lodgepole: Seasonal Emergence Across all Cages by Gender MPB emerged from limber pine than from lodgepole than limber pines were in the plots; 2) the greatest Limber Diameter Size Class and 1:1.45 limber and Lodgepole 400 pine (Fig. 6). Overall emergence density, male frequency of both species were between 5 and 20 cm in st 350 1 Lodgepole: lodgepole, respectively. 300 emergence density and female emergence density varied Fig. 1 diameter; and 3) the largest diameter trees in the 250 However, the comparison 200 by host species (Table 1). In addition, emergence stands were limber pine. The mean density of trees (no./ha) across all plots was 1018; mean basal area (m2/ha) was 150 Week of Collection of 2004 funnel traps to varied by gender as well as by date from the two 100 35.2. Mean density and basal area of limber pine were 193 trees/ha and14.1 m2/ha, respectively. Corresponding 50 0 Fig. 11 measurements for lodgepole were more than three times (683) and more than 40% higher (20.1), respectively. Comparison of Sex Ratios from Trap and Emergence Cage Collections (2004 and 2005) Limber Lodgepole Limber Lodgepole 2005 emergence cages shows a As the outbreak progressed over time, host species selection began to shift from limber to lodgepole pine MPB Mean Mean Emergence Emergence noteworthy similarity (Fig. 12). 1:3.3 Collected Collected Dates Dates 3.5 (Fig. 2, red ovals). Between 2004 and 2005, the Tree Mortality Caused by MPB Date of Collection 2 In 2005 MPB were collected in (no./0.3 m ) (no./0.3 m2) incremental number of attacked lodgepole surpassed 3 196 Male Female July 8th June 17th traps from July 1st through 180 Male the number of attacked limber, which was the initial through through rd 60.3 25.9 Fig. 7 2.5 Sept. 16th Sept. 9th Oct. 3 and emergence was June preferred host. Still, the 2005 cumulative attack ratio 144 th June 24th June 10th 10 (lodgepole) through Sept. 132 Limber: Seasonal Emergence Across All Cages by Gender 126 1:1.63 1:1.5 for lodgepole was much less (1:14.2) 2 Female through through 23rd (limber). But, in 2004 trap 1:1.45 94.5 35.5 108 rd th Sept. 23 Sept. 7 (attacked:unattacked) than for limber (1:1.7). As a 400 st Limber: collections were more compatible 1 1.5 Total 69 166.5 69.2 64 300 result, the intermediate and larger diameter classes of 54 with emergence of 2005: June 48 Table 1 39 39 200 36 1 limber pine were eliminated from the stand (Fig. 3), in 27 host species (Fig. 7 and 8, Table 1). Peak emergence 19th through Oct. 30th 18 18 100 5 00 4 00 5 9 9 05 6 10 s 2 00 ps 2 ps 2 contrast to lodgepole pine, which still had a substantial es 20 a ge Tra Tra 0 was the week of Aug. 12th for both sexes from . Cag (Figs. 7, 8 and 11). E. C le E ber gepo Lim number of trees in the intermediate diameter classes Lod n un un Ju l Ju l ul ul ul ug ug ug ug e p e p ep ep Year of Attack both host species. The sex ratio of emerging beetles u J J J S S -J -J -J 1 8 1 5- 2 2- 2 9- 5 -A 2-A 9-A 6-A 2 - 9 - 6-S 3-S 2 1 10 17 24 (Fig. 4). 2 1 1 changed over time; and, the sex ratio also varied Fig. 12 Limber Lodgepole Limber Cumulative Lodgepole Cumulative Cumulative (both species) Conclusions: Date of Collection by host species (Fig. 9). However, the overall sex Limber was the initial preferred host in the mixed stands of limber/lodgepole Male Female Fig. 2 ratio was virtually identical between the two host Several critical intermediate and large diameter size classes of limber were almost Fig. 8 At the end of the 2005 field season, a series of statistical species: 1:1.45 (males:females) for lodgepole and eliminated from these mixed stands, likely impacting succession analyses (Pearson’s χ2 statistic) within diameter class showed 1:1.63 (males:females) for limber (Fig. 12). This study suggests a possible shift in host preference from limber pine to lodgepole pine, the cumulative percentage of limber pine attacked was Comparison of Sex Ratios Across Seasonal Emergence but a longer term study would clarify the progress of the infestation significantly larger in four of eight classes analyzed (Fig. 5). In 7 out of 10 cases more MPB emerged from limber than from lodgepole Two other classes only had attacked limber pine in them. 2.5 The mean number of emerged MPB males was higher in limber than in lodgepole 2 The most notable differences were in the intermediate diameter 1.5 The mean number of emerged MPB females was higher in limber than in lodgepole classes. Specifically: 1 Fig. 3 MPB emergence periods varied between limber and lodgepole but peak emergence was 0.5 In the 25-30 cm class 92% of the limber and 0 identical 21% of the lodgepole were killed Correlation between MPB emergence and MPB flight period is likely, but cannot be proven In the 30-35 cm class 96% of the limber and with this data 38% of the lodgepole were killed Evaluate sex ratios of flying and emerging MPB in mixed stands in 2005 N u m b e r C o lle c te d 300 2 50 200 150 10 0 50 0 200 180 160 120 1200 100 80 1000 Number Collected Number of Trees 140 60 40 20 < 5 5-1 0 10 -1 5 15 -2 0 20 -2 5 25 -3 0 30 -3 5 35 -4 0 40 -4 5 45 -5 0 50 -5 5 55 -6 0 60 -6 5 65 -7 0 70 -7 5 >7 5.0 0 800 600 400 200 of Ju ne 1st w k of Ju ly wk of July 3rd wk of July 4th wk o f Ju ly 5th wk o f Ju ly 1st w k of Aug . 2nd wk o f Aug . 3rd wk of Aug . 4th wk o f Au g. 1st w k of Sept . 2nd wk of Sep t. 3rd wk of Sep t. 4th wk o f Sep t. 1st w k of Oct. 2nd wk of Oct. 3rd wk of Oct . 4th wk of Oct . Males 05 Females 05 -J u 24 n -J un 1Ju l 8Ju 15 l -J ul 22 -J u 29 l -J ul 5Au 12 g -A ug 19 -A u 26 g -A ug 2Se p 9Se p 16 -S ep 23 -S ep -J 10 Fe males 04 17 un Male s 04 2nd 4th wk 3rd wk of N u m b e r C o lle c te d June 0 Sex Ratio (M :F) 200 18 0 14 0 12 0 10 0 80 60 40 20 0 B e f o re 20 0 3 2003 2004 2005 N um b er C o lle cte d N u m b e r o f T re e s 16 0 Limber: Comparison of 2004 Diameter Distribution with Cumulative Distribution of Attacked Trees in 2005 70 Number of Trees 60 50 40 30 20 10 Sex Ratio (M:F) 5-1 0 10 -1 5 15 -2 0 20 -2 5 25 -3 0 30 -3 5 35 -4 0 40 -4 5 45 -5 0 50 -5 5 55 -6 0 60 -6 5 65 -7 0 70 -7 5 >7 5.0 < 5 0 Diameter Size Class T otal Limber At tacked Limber Lodgepole: Comparison of 2004 Diameter Distribution with Cumulative Distribution of Attacked Trees in 2005 200 un 17 -J un 24 -J un 1Ju l 8Ju l 15 -J ul 22 -J ul 29 -J ul 5Au 12 g -A ug 19 -A u 26 g -A ug 2Se p 9Se p 16 -S ep 23 -S ep 180 10 -J 160 Number of Trees 140 120 100 80 60 40 20 5 < 5-1 0 10 -1 5 15 -2 0 20 -2 5 25 -3 0 30 -3 5 35 -4 0 40 -4 5 45 -5 0 50 -5 5 55 -6 0 60 -6 5 65 -7 0 70 -7 5 >7 5.0 0 Date of Collection In the 35-40 cm class 89% of limber and 35% of the lodgepole were killed Lodgepole Limber Fig. 9 Diameter Size Class (in cm) T ot al Lodgepole At tacked Lodgepole Fig. 4 100% 90% 80% 70% 60% 50% 40% 30% 20% 10% 0% ns ns 50 -5 5 55 -6 0 40 -4 5 45 -5 0 35 -4 0 30 -3 5 25 -3 0 Acknowledgements 20 -2 5 Percentage Comparison of Percentage of Attacked Trees for Both Pine Species by Diameter Class (Before 2003 through 2005) Diameter Size Classes (in cm) Lodgepole Future Directions: The apparent fidelity to limber pine in the mixed stands, along with the reproductive success of MPB in limber, suggests a mechanism based on an underlying nutritional component and/or possible host race formation. The nutritional component was explored using stable isotope analysis. Results from this work will be available soon. Limber Fig. 5 Cumulative (before 2003-2005) percentages of attacked trees were compared by species within diameter class by using a 2 X 2 contingency table (Pearson’s χ2 statistic). Star denotes a significant difference within diameter class, ns = not significant, α=0.05. NOTE: There were no lodgepole pines in the two largest size classes; the 40-45 cm size class had only two lodgepole pines, tending to skew results. Area of Medicine Bow National Forest Woodpecker predation of MPB on limber pine Stand containing plot 2 in the Medicine Bow National Forest University of Wyoming: Richard Olson, Scott Schell, Kirk Van Dyke USDA Forest Service FHP: Willis C. Schaupp, Jr., Rapid City, S.D., JeriLyn Harris, Robert Cain, Kelly Sullivan-Burns, Jeff Witcosky, Lakewood, CO John Schmid, Fort Collins, CO. Jana C. Lee, USDA Forest Service PSW, Davis, California Jose F. Negron, USDA Forest Service RMRS, Fort Collins, CO USDA FS Forest Health Monitoring Funds Grant #INT-EM-05-04
