VIII. PHYSICAL ACOUSTICS B. L. Chrisman
advertisement

VIII.
B.
P.
K.
G.
A.
Prof. K. U. Ingard
Dr. L. W. Dean III
Dr. G. C. Maling, Jr.
Dr. H. L. Willke, Jr.
A.
PHYSICAL ACOUSTICS
L.
A.
W.
M.
A.
Chrisman
Fleury V
Gentle
Irwin
Maduemezia
W.
J.
S.
J.
SOUND EMISSION FROM AN AMPLITUDE-MODULATED
M. Manheimer
H. Turner
D. Weiner
M. Witting
RADIOFREQUENCY
DISCHARGE
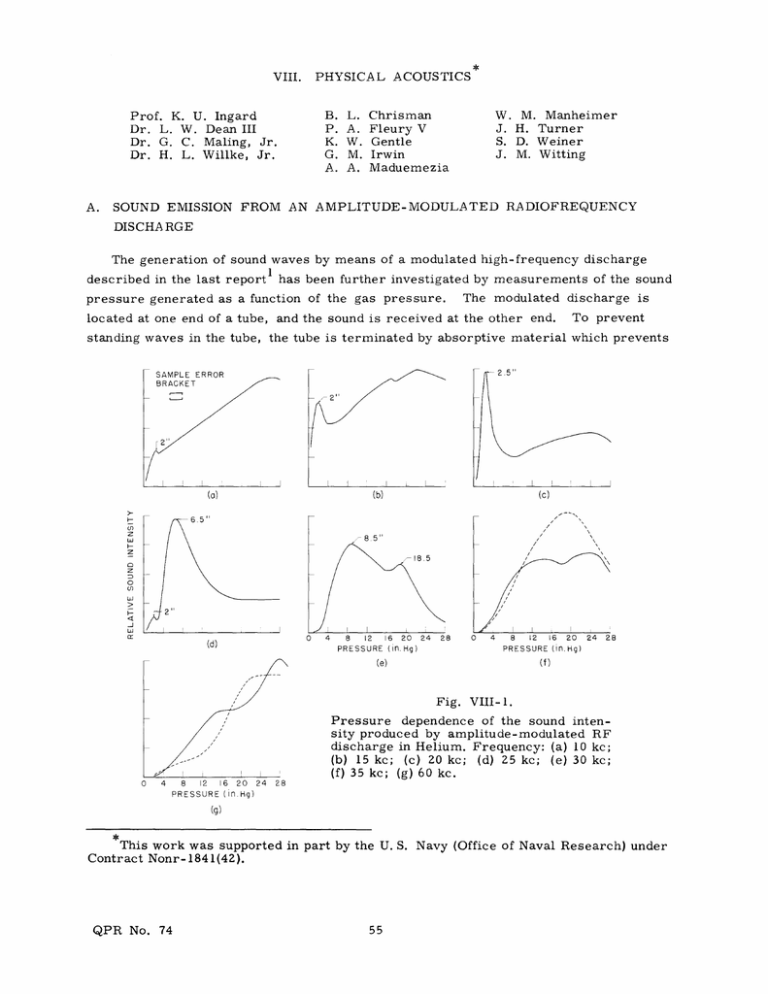
The generation of sound waves by means of a modulated high-frequency discharge
described in the last report
has been further investigated by measurements of the sound
pressure generated as a function of the gas pressure.
The modulated discharge is
located at one end of a tube, and the sound is received at the other end.
To prevent
standing waves in the tube, the tube is terminated by absorptive material which prevents
2.5
2"
(c)
(b)
8.5
18.5
4
8
12
16 20 24
PRESSURE (in.Hg)
28
0
4
8
12
16 20
PRESSURE (in. Hg)
(e)
24
28
(f)
Fig. VIII-1.
Pressure dependence of the sound intensity produced by amplitude-modulated RF
discharge in Helium. Frequency: (a) 10 kc;
(b) 15 kc; (c) 20 kc; (d) 25 kc; (e) 30 kc;
(f) 35 kc; (g) 60 kc.
0
4
8
12
16 20 24
PRESSURE (in Hg)
28
(g)
This work was supported in part by the U. S. Navy (Office of Naval Research) under
Contract Nonr- 1841(42).
QPR No. 74
PHYSICAL ACOUSTICS)
(VIII.
sound reflection.
A typical sequence of curves illustrating the pressure dependence on
These curves refer to generation into
the acoustic intensity is given in Fig. VIII-1.
It is interesting to note that a "resonance" occurs at a certain pressure,
helium.
the pressure at this resonance increases as the frequency increases.
have been obtained for argon.
and
Similar results
This effect is not yet understood and further work is in
progress.
B. L. Chrisman,
G.
M. Irwin, U. Ingard
References
1. B. L. Chrisman and G. M. Irwin, Investigation of ultrasonic coupling and relaxation effects at a corona-neutral gas interface, Quarterly Progress Report No. 73,
Research Laboratory of Electronics, M.I.T., April 15, 1964, pp. 23-24.
B.
FLOW STABILITY AND THE ENERGY IDENTITY
Difficulty with a class of perturbed flows of irregular time dependence,
whose insta-
bility would seem to indicate creation of energy, has led to an investigation of the energy
sources for unstable flows.
It will be seen that, in an exact analysis, the total kinetic
energy of perturbation tends to zero with time for perturbations not affecting the strength
of the energy sources for the basic flow.
The energy identity for the Navier-Stokes equations is obtained formally as follows:
0=
d3 y
Vi(ati-
V
e
=~
d32
d3yt
d=
V
Clearly, if v
vi i j j i+i
i
i + v j a j(2P
-vviAv
00, and if the boundary conditions on P and the v i are so prescribed
that the surface integrals in (1) vanish, then the v. will tend to zero for large t.
ticular, if v
'
t
so that
QPR No. 74
2
is integrable, we have
v2
2
3
d 3 y = -v
(v
In par-
1
)
2
3
d3y < 0,
v 2 d 3 y must continue to decrease in time as
long as one of the
(VIII.
PHYSICAL ACOUSTICS)
v. is nonzero somewhere.
1
When applied to the stability problem for parallel flows, the energy identity demonstrates for us the nonexistence of spatially localized instabilities:
plausibly enough, the
perturbation must encompass an energy source for the basic flow.
If we suppose the basic parallel flow to be directed along the x 3 coordinate,
write for the perturbed flow v i = u i + W(x
a.x P = 0.
1, x Z)
i3
P = p + x3Po,
with -vAW6i
we may
3
+
13O
In order to avoid difficulties associated with an infinite total energy
5
dx
1
dx2
5
dx 3 w
2
for the basic flow, we consider the term-by-term limit of the difference between the
energy identities associated with the perturbed and unperturbed flows as we extend the
Supposing that the u i are integrable and
domain of integration to the whole space.
vanish at rigid boundaries and, for simplicity, that W is bounded, and suppressing in
advance terms that vanish in the limit, we get
&s5
V
3
d y at
+ v(a jv)
d3
t
-
2
-
v(2jWi)
)2 -
(jui
V
5
v(W) u 3
dS[-vWanu 3
+
V
d3 y '
+ v(
+6
n
dS[-vW
3
Wp+
u3 +n
"
3 Wp+. ..
V
ui 2
+
U3
dS[-vW
Boundaries
E3
+ lim
+
5
dx 1
5
dx 2 W[p(x 3 )-p(-x 3 )].
(2)
x 3-
If there are no sliding boundaries, then WB
we want:
If p(x 3 ) - p(-x
v * 0,
d3
v
3 ) = o(1),
0
so that (2) gives us what
then all surface contributions vanish, so that, with
is strictly negative as long as any of the u. are nonzero.
Under
these conditions, v2 cannot remain everywhere positive unless the u. tend to zero almost
everywhere in time.
If sliding boundaries are admitted, these considerations hold only
if anu 3 vanishes at such boundaries.
In general, perturbations must couple to the energy
sources for the basic flow if they are not to decay in time; that is,
the surface terms
must not vanish.
In the special case v = 0, the basic flow maintains itself without energy sources,
QPR No. 74
(VIII.
PHYSICAL ACOUSTICS)
so Po = 0, and it is no longer possible to extract energy from sliding boundaries.
On
the other hand, since no sources of dissipation exist, we have
d3y = 0,
even when the remaining surface term vanishes, so that the perturbed flow maintains
itself in the mean.
H. L. Willke,
C.
Jr.
ACOUSTIC POWER RADIATED BY A MONOPOLE SOUND SOURCE IN A DUCT
The acoustic power (W) radiated by a sound source located near boundaries may be
quite different from the power output in free space (W ).2
Ingard and Lamb
Waterhouse2 have dealt with sources near rigid surfaces.
Solutions for W/W
and
when
the surface is partially reflecting have been presented by Grine,3 Maling,4-6 and
Waterhouse7 for various boundary conditions.
stant mass flow) monopole the expression
W
=1 +- 1 Im
o
6
For a constant-strength (that is,
for W/W
°
con-
is
(pr),
(1)
kA
where Im (pr) is the imaginary part of the reflected pressure at the source.
pressure is ps = (A/r) exp(ikr),
and k is the wave number,
w/c.
The source
The solutions for
W/W 0 that have been worked out thus far deal with sources between parallel walls, in
a corner, and over an infinite plane.
One interesting extension of this work is a calculation of W/W
source in a duct.
If the source is located at position (x , Yo, z
dimensions a and b in the x-y plane,
for a point-monopole
) in a duct that has
and is infinite in the z-direction, the sound field
can be shown to be
p(x, y, z) = 2ri wQ
{cos (kxx-
pxy) Qk
k2-k
xky
xy
x)
cos (kxx -
x )
21/2
xy
cos (kyy- y) cos (kyYo_ y)} exp(ikz(z-zo)-it),
(2)
where p is the sound pressure at the field point, Qo is the strength of the source,
is the frequency,
kx and ky are solutions to tan (knL/2) = --ikp /k
and cot (knL/2) = ikpn/k
resents a or b.
QPR No. 74
A
x
n
for the odd modes.
and A
y
Here, n represents
are normalization constants,
and k
z
n
o
for the even modes,
x or y, and L rep-
= (k2-k-2
xy/
1/2. Also,
(VIII.
n = -tan- 1 (ikpn/k ).
For hard walls in a duct (
n
PHYSICAL ACOUSTICS)
= 0), and the power output of the source can be found
by integration of the acoustic intensity in the propagating modes. For example, the
ratio W/W 0 is 2rr/k2ab for the plane-wave mode, and can be found easily for the higher
modes. Thus, W/W 0 can be found as a function of k for a constant-strength source.
If the source is of the constant-pressure type, it is necessary to evaluate Eq. 2 near
the source, and remove the asymptotic eikr/r dependence in order to find both the real
and imaginary parts of the reflected pressure at the source. Both are needed because
the mass flow produced by the source must adjust itself to keep the total pressure at
the surface of the source constant.
If the duct walls are hard, or if a plane-wave reflection coefficient can be used to
describe the effect of the boundary, an image description can be used to find the reflected
pressure at the source. It can be shown that the ratio W/W for a constant-pressure
source of radius a is
1
1 + k Im
W
Wo
1++ 2a Re (pr
)
(pr)
Sr(3)
+ a
pr l 2
Note that p is assumed to be of the form eikr/r, and therefore has dimensions 1/length.
Image solutions have been found for a source in the center of a square duct with rigid
3.5
3
k = 129
IMAGINARY PART
m:66
2
n=66
70
Sm
0
11
REAL PART
IMAGINARY PART
n= 70
m=63
n =40
CD_
I
ARRAY SIZE--REAL
PART
REAL PART
m
70
n z7,
-2
Fig. VIII-2.
QPR No. 74
Real and imaginary parts of the reflected pressure
The abscissa is the
at the source for k = 12. 9.
array size, the points being those that satisfy the
criteria that have been discussed.
(VIII.
PHYSICAL ACOUSTICS)
walls (side length = L) by programming an IBM 7094 computer to sum up the images.
The program was written so that the pressure field from groups of images (at least four
images to a group) were printed out when the total image strength was less than one.
This procedure insured that the convergence would be reasonably rapid. The cumulative
total was printed out for these groups. A typical calculation is shown in Fig. VIII-2.
The calculations are cut off when the array of images reaches 70 X 70, and it can be
seen that a 66 X 66 array (for the imaginary part of the pressure) and a 63 X 40 array
(for the real part of the pressure) are much more consistent with earlier groups that
meet the criterion discussed above than the 70 X 70 array calculation which does not.
Thus, it is important to choose carefully the order in which the terms are taken to
insure -convergence of the partial sums of the series.
The ratio W/Wo can be found for a constant-strength source either by use of the
Green's function method described above, or by the summation of images. The latter
method was used in the calculation of the curves shown in Fig. VIII-3. This plot emphasizes the difference between the power output of the constant-strength source in free
space and the power output in a duct. An alternative method of treating the data is to
plot the power output relative to its value at k = 0. This has been done, and the results
are shown in Fig. VIII-4. It can be seen that coupling to the higher order modes is considerably stronger than the coupling to the plane-wave mode (k < 6. 28 for the plane wave
mode, the first cross mode is not excited).
For a constant-pressure source the image technique is most convenient,
and,
10
9
8
7
6
W
Wo 5
CONSTANT
STRENGTH MONOPOLE SOURCE
4
3-
2
10
-i
20
A
0
2
3
4
21
22
30 31
i
5
6
23
I
7
8
9
10
II
40 41 33 42
I
I
12
13
14
34 51
15
16
52
44 53 60
17
kL
Fig. VIII-3.
QPR No. 74
W/Wo0 vs kL for a source in the center of a hard duct.
18
19
0
I1
2
3
4
I
5
I
I
6
7
8
9
10
11
12
13
14
II
15
16
17
19
18
kL
Fig. VIII-4.
W/Wk= 0 vs kL for a source in the center of a hard duct.
I
a= OIL
2
3
a= OO5L
a=OOIL
2'
2
2
3
3
2
3
4
5
6
7
8
9
10
II
12
13
3
14
kL
Fig. VIII-5.
QPR No. 74
WQ/Wp as a function of kL.
15
16
17
18
19
(VIII.
PHYSICAL ACOUSTICS)
according to Eq.
3, the ratio W/W
is the same for either type of source if a = 0.
For
a * 0, the image method is only approximate, but should be valid, provided that the
source size (a) is small compared with the x (or y) dimension (L) of the square duct.
The ratio WQ/Wp has been plotted in Fig. VIII-5 for three values of a,
a = 0. 05 L, and a = 0. 1 L.
a = 0. 01 L,
Here, Wp is the output of a constant pressure source, and
WQ is the output of a constant strength (volume velocity) source.
It can be seen from Fig. VIII-5 that for small sources the power output of a constantpressure source is nearly the same as for the constant-strength source.
sources, the difference between the two types becomes greater.
For larger
Since the image
description is strictly valid only for very small sources, no calculations were made for
values of a/L greater than 0. 1.
G.
C.
Maling, Jr., U.
Ingard
References
1. U.
2.
Ingard and G.
L. Lamb, Jr.,
R. V. Waterhouse,
J.
J.
Acoust. Soc. Am. 29,
743 (1957).
Acoust. Soc. Am. 30, 4 (1958).
3. D. R. Grine, Quarterly Report, Acoustics Laboratory,
1957, p. 15.
M. I. T.,
4. G. C. Maling, Jr., Quarterly Progress Report No.
of Electronics, M.I.T., October 15, 1958, pp. 107-110.
Research Laboratory
D.
5.
G.
C.
Maling, Jr.,
J. Acoust. Soc.
6.
G.
C. Maling, Jr., J.
7.
R. V. Waterhouse, J.
Acoust.
Am. 31,
Soc. Am.
Acoust. Soc. Am.
51,
July-September
115 (1959).
36, 781 (1964).
35, 1144 (1963).
STUDIES OF SHOCK STRUCTURE
The observation of hydraulic jumps to shed light on the structure of collisionless
shock waves in plasma was reported in the last quarterly report. I
These previous
experiments showed that neither the "thinnest shock hypothesis" nor the "thickest shock
hypothesis" has general validity.
The experiments have continued.
The new results,
when carried over to the plasma and coupled with some new plasma theory, contain
some novel features.
Hydraulic-jump structure has been examined at various water depths as a function
of Mach number.
At small Mach numbers, below M = 1. 25, the structure is charac-
terized by waves whose length is fairly long, compared with the depth of water.
waves are a permanent feature of the jump structure,
These
in that they travel at exactly the
same speed as the jump, and so they stand still in jump coordinates.
If gravity is the
predominant restoring force, these waves stand behind the jump; if,
on the other hand,
surface tension is the predominant restoring force (this can be obtained experimentally
QPR No. 74
(VIII.
PHYSICAL ACOUSTICS)
by reducing the water depth to approximately 0. 5 cm), then they stand ahead.
These results can be carried over to plasma.
the mag-
There are plasma waves,
netoacoustic waves, which have all of the essential properties to make them a permanent
feature of the collisionless shock wave, like the long surface waves in shallow water.
Thus, the existence of finite-amplitude magnetoacoustic waves that stand in shock coordinates is expected.
Some simple theorizing about these waves and their role in the collisionless shock
leads to the following predictions:
If the magnetic field is perpendicular,
or almost
perpendicular, to the direction of the shock, the waves will stand behind the shock front,
and will be of approximate length
tron and ion, respectively, and r i
acoustic
speed.
and m. are the masses of elec1
e
is the gyroradius of an ion moving at the magnetome/m
If, on the other hand,
i
r., where m
away from the plane
the magnetic field lies
perpendicular to the shock direction, the waves will stand ahead of the shock front, and
will be of approximate length r .
The transition between these regimes is smooth, and
occurs when the magnetic field is at an angle
7,me7mi away from the plane perpendicular
to the shock direction.
As the strength of hydraulic jumps is increased, the long wave becomes of such large
amplitude that it breaks, and the character of the hydraulic jump changes.
bulence now appears,
Surface tur-
as does a different wave, of much shorter wavelength.
This
second wave, like the long wave that appears for weaker jumps, stands still in jump
coordinates.
The excess energy carried by the supersonic flow into the jump front is
no longer converted to waves that carry the energy downstream; instead, the energy
is dissipated right at the jump front by viscous damping of the surface turbulence and
standing waves.
There are two outstanding features in these stronger jumps.
that the long wave is
in the case of plasma
no longer excited and its consequences
shocks was discussed in the previous report.
The fact
1
Another feature is the pronounced tendency for short-wavelength waves traveling at
the same speed as the hydraulic jump to be excited, as well as the fact that the scale
The three ingredients necessary for
of turbulence is largest around this wavelength.
this behavior are:
(i) the long wave breaks, if strong enough;
waves traveling at the jump speed are possible;
(ii)
short-wavelength
and (iii) standing waves are prefer-
entially excited.
These three ingredients are also present in the collisionless plasma.
I can argue
on quite general grounds that waves whose phase velocity is the same as the source
speed (the shock front being the source,
matter what the medium.
in this case) are preferentially excited,
As the amplitude of long (that is,
no
of order r. or /meimr.)
1
e
1
waves increases, because of increasing Mach number, such long waves become unstable,
and so they "break" into smaller wavelength disturbances.
stand are of order (me/mi)ri and of order (wc/
QPR No. 74
The wavelengths that can
p)ri, where w /w
is the ratio of plasma
(VIII.
PHYSICAL ACOUSTICS)
frequency to ion-cyclotron frequency.
The former mode is an electron-cyclotron wave;
the latter is an electrostatic oscillation.
Their presence is expected for strong col-
lisionless shocks, and their decay by Landau damping and collisional damping should
provide the energy dissipation associated with the collisionless shock wave.
J. M. Witting
References
1. J. M. Witting, Studies of shock structure, Quarterly Progress Report No. 73,
Research Laboratory of Electronics, M. I. T., April 15, 1964, pp. 27-28.
QPR No. 74


