VI. FREQUENCY MODULATION Prof. E. J. Baghdady
advertisement

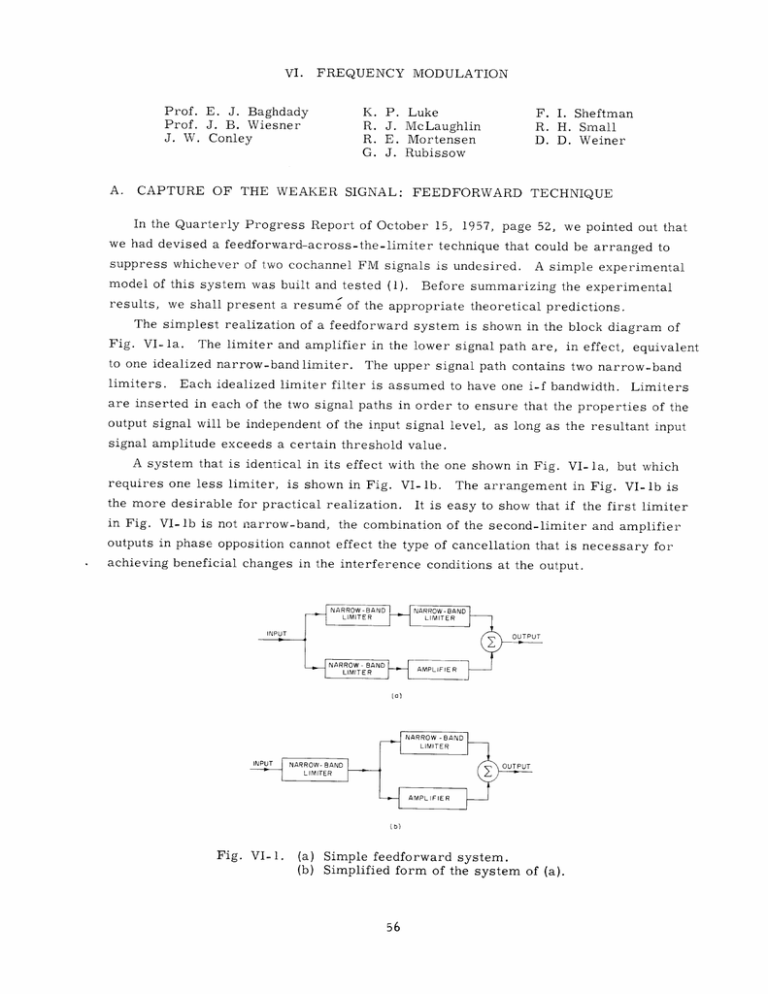
VI. Prof. E. J. Baghdady Prof. J. B. Wiesner J. W. Conley A. FREQUENCY MODULATION K. R. R. G. P. J. E. J. Luke McLaughlin Mortensen Rubissow F. I. Sheftman R. H. Small D. D. Weiner CAPTURE OF THE WEAKER SIGNAL: FEEDFORWARD TECHNIQUE In the Quarterly Progress Report of October 15, 1957, page 52, we pointed out that we had devised a feedforward-across-the-limiter technique that could be arranged to suppress whichever of two cochannel FM signals is undesired. A simple experimental model of this system was built and tested (1). Before summarizing the experimental results, we shall present a resume of the appropriate theoretical predictions. The simplest realization of a feedforward system is shown in the block diagram of Fig. VI- la. The limiter and amplifier in the lower signal path are, in effect, equivalent to one idealized narrow-band limiter. The upper signal path contains two narrow-band limiters. Each idealized limiter filter is assumed to have one i-f bandwidth. Limiters are inserted in each of the two signal paths in order to ensure that the properties of the output signal will be independent of the input signal level, as long as the resultant input signal amplitude exceeds a certain threshold value. A system that is identical in its effect with the one shown in Fig. VI- la, but which requires one less limiter, is shown in Fig. VI-lb. The arrangement in Fig. VI- lb is the more desirable for practical realization. It is easy to show that if the first limiter in Fig. VI-1b is not narrow-band, the combination of the second-limiter and amplifier outputs in phase opposition cannot effect the type of cancellation that is necessary for achieving beneficial changes in the interference conditions at the output. Fig. VI- 1. (a) Simple feedforward system. (b) Simplified form of the system of (a). (VI. FREQUENCY MODULATION) In the analysis of the equivalent feedforward systems of Fig. VI-la and b we note that for a given weaker-to-stronger signal-amplitude ratio a at the input, the conditions of interference that arise with the frequency differences r = 0 and r = (BW)if are of special interest. The importance of these two limiting conditions stems from the fact that the amount of reduction in the equivalent weaker-to-stronger signal-amplitude ratio that will be effected by a chain of narrow-band limiters decreases with a decrease in the value of the frequency difference, r, between the two signals, relative to the limiter bandwidth. The effect of narrow-band limiting upon the FM disturbance caused by two-signal interference will increase with an increase in the degree of frequency-band limitation suffered by the amplitude-limited resultant of the two signals when they go through the limiter For r = 0, the amplitude-limited resultant of the two input signals will experience no frequency-band limitation in going through the limiter filters, while the greatest possible band limitation will be experienced with r = (BW)if. When the frequency difference r lies between r = 0 and r = (BW) if, the effect of passing the resultant signal through the system will be intermediate between the extremes indicated for r = 0 and filter. r = (BW)if. Thus, for frequency differences that exceed one-half of the i-f bandwidth, the spectrum at the output of the idealized narrow-band limiter will consist of only two components that have the frequencies of the two input sinusoids. If the two signal paths are assumed to have identical phase characteristics, an additive combination of the path outputs results in two signals with new relative amplitudes 1 and aout . A family of curves for aout versus a is shown in Fig. VI-2, with K as a running parameter (K is the ratio of the output of the lower signal path to the output of the upper signal path when the input excitation is a single unmodulated carrier). Negative values of K can be interpreted as indicating the condition in which the phase characteristics of the two paths differ by a constant value of 7r (or by an odd multiple of it) but are otherwise identical functions of frequency. The parameter K depends only on certain design constants of which the gain of the amplifier is an easily controllable factor. Evidently, K would not be a constant that is subject to a priori adjustment for all usable signal levels at the input if the lower signal path did not contain the limiter that is shown. It will become evident presently that a constant value of K that is substantially independent of the input signal levels is an important requirement for achieving inferferencesuppression performance that is independent of the input signal level. The curves of Fig. VI-Z reveal some interesting possibilities in relation to the capture of the weaker or stronger of the two input signals under the conditions of this analysis. For example, for values of K that lie in the range -0. 8 < K < 0, the system will depress the ratio of weaker-to-stronger signal amplitude to a value that is smaller than 0. 4 for all input values of this ratio that are below 0. 9. This represents substantial enhancement of the predominance of the originally stronger signal. The curve for (VI. FREQUENCY MODULATION) 0o -02 Fig. VI-2. Plots of the ratio of weaker-to-stronger signal amplitude, aout' at the output of the system of Fig. VI- la as a function of the input ratio a, when the frequency difference exceeds one-half the i-f bandwidth. K = -0. 6 shows that a is less than 0. 05 for all a less than 0. 8. Values of aout > 1 correspond to the situation in which the combination of the signalpath outputs enables the originally weaker signal to emerge as the stronger of the two. Thus, for K = -1.05, aout is greater than 1 for all a in the range 0. 16 < a < 1. This potentiality for capturing the weaker signal is even more clearly brought out by the curves of 1/aou t versus a shown in Fig. VI-3. It is evident that as -K approaches 1 from the right, the range of a values in which the originally weaker signal will emerge as the stronger widens and its lower limit approaches a = 0. But values of K that are centered about -1 indicate signal cancellation that becomes more and more complete as K approaches -1. It is clear, therefore, that a limit on how closely K can approach -1 is placed by considerations that relate, first, to the random noise level at the output of the system, and, second, to the signal-level requirements and sensitivity of the stages driven by it. Consider, next, the situation in which r approaches 0. For values of r that are less than r min = 1-a a (BW) 1 + a if where p z 0. 2 for an ideal filter, the signal at the output of each limiter filter will approach the amplitude-limited resultant of the two input signals more and more closely Consequently, the signal at the output of the system shown in Fig. VI-3a will approach FREQUENCY MODULATION) (VI. eout(t) = k 2 (l+K) cos[pt + 0(t)] where -1 0(t) = tan a sin rt 1 + a cos rt and p is the frequency of the stronger signal (in rad/sec). It is evident that for values of r that make up a small fraction of the limiter-filter bandwidths, the average frequency of the output signal will always equal the frequency of the stronger input signal. This means that if the chosen value of K enables the system to deliver an output signal whose average frequency equals the frequency of the weaker signal when r is equal to one i-f bandwidth, this condition for the capture of the weaker signal will not subsist as r takes on values that are small fractions of the i-f bandwidth. Consequently, with a given value of input weaker-to-stronger signal-amplitude ratio, the capture at the output of the system will shift from the weaker to the stronger signal as r is decreased, and back to the weaker signal as r is increased again. The transition in the capture will take place within a frequency-difference range centered about a value of r that is intermediate between zero and (BW)if/2. While r is going through this range of r values, the reception at the output of the succeeding FM demodulator will be marred by the severe distortion that is usually experienced with conventional FM receivers when a approaches 1. Evidently, if either of the systems of Fig. VI-la and b is used to facilitate the capture of the weaker signal, it should be followed by an FM demodulator of high stronger-signal 06 -07L 1 0 -0 95 0 Fig. VI-3. 02 03 04 05 06 07 08 09 10 Plots of 1/aou t versus a. (VI. FREQUENCY MODULATION) 2 2 10O0-CYCLE 0 /400-CYCLE COMPONENT H-i HZ ,wa SIGNAL A: MODULATION FREQUENCY,1000 CPS 4/ FREQUENCY DEVIATION,t75KC 0 FEEDFORWA LL (_ LLj LLJ wO 00 0T ...- MODULATION FREQUENCY, 400 C PS FREQUENCY DEVIATION, * 75KC SIGNAL 8: RECEIVER FEEDFORV CENTER- FREQUENCY SEPARATION,ZERO WZ H a 0.2 Fig. VI-4. 0.4 0.3 0.5 0.6 3 2 0.8 4 5 6 8 10 Stronger-signal capture characteristics of experimental receiver with and without feedforward. c Z A 0 o a SIGNAL A S50IHg 20 MODULATION FREQUENCY,IKC DEVIATION,75 KC SIGNAL B: MODULATION FREQUENCY, 400 CPS, DEVIATION,75 KC CENTER -FREQUENCY 8 0 _ Z _ D LL LL)b 0.2 I I 0.3 04 I 05 I I 06 08 I I 2 I I 3 4 SEPARATION, ZERO I_ I 5 6 7 8 910 OIOH- i- Z 100 A --- --- a , SIGNAL A: MODULATION FREQUENCY,IKC DEVIATION 35KC LL 0 Uj 0 50 SIGNAL B: _j MODULATION FREQUENCY, 400CPS, DEVIATION 35KC CENTER-FREQUENCY ' 02 03 04 0.5 06 SEPARATION,ZERO II I 18I 08 I 2 3 4 5 6 7 8 9 10 Fig. VI-5. Weaker-signal capture characteristics of the feedforward receiver: cochannel signals. capture capability, in order to minimize the duration of the severe distortion that accompanies the capture transition from one signal to the other. If the system is used to suppress the weaker signal, no capture transitions will arise in the course of a modulation cycle. Hence the system should perform better as a weaker-signal suppressor when the frequency difference between the two input sinusoids goes to zero during every modulation cycle. The capture-transition distortion, which appears whenever the two signals pass through a condition of zero frequency difference, constitutes a performance limitation on the simpler (and more practical) forms of the feedforward technique in applications (VI. z w FREQUENCY MODULATION) 100r 0 0 (2 •o-z BB 400 CPS FREQUENCY, SIGNALB: MODULATION DEVIATION , 35 KG 0Q < FREQUENCY,IKC SIGNAL A: MODULATION DEVIATION,35KC CENTER- FREQUENCYSEPARATION ,75 KC 0 A I -J 0 LO ELJ ' LL • 50 z== 0.02 003 0.04 0.05 0.2 0.3 0.5 0.6 04 0.8 I 0.8 I .- B/ OZ LLO 0 Z)aý5 _j (L 0. SIGNAL A: MODULATION FREQUENCY, IKC ,10 KC DE VIATION 4 00 CPS FREQUENCY, B: MODULATION SIGNAL IOKC DEViATION, SEPA~RATION,75 KC CENTER -FREQUENCY A n U 0.01 0.02 0.03 0.2 0.04 0.05 0.3 0.4 0.5 0.6 0 -~- Fig. VI- 6. Weaker-signal capture characteristics of the feedforward receiver: optimum performance with half-channel signals. that require close reproduction of the weaker-signal message. If the two signals are cochannel, they may often pass through zero frequency difference, with consequent severe distortion in the weaker-signal reception at the receiver output. However, if the center frequencies of the signals are separated so that their instantaneous frequencies seldom, or never, coincide, the distortion will not be present. In a way, the feed- forward scheme of Fig. VI- lb is an extremely simple realization of a simulated ideal bandpass filter with extremely sharp cutoff characteristics for FM signals. An experimental feedforward system based on the block diagram of Fig. VI-lb was built (1). The measured capture performance of this system is illustrated by the plots of Figs. VI-4, VI-5, and VI-6. (a) Fig. VI-7. The signals used in the measurements are described (b) Capture performance of experimental feedforward receiver when the signals have the same center frequency. (a) Weaker-signal modulation (400 cps). (b) Detected weaker- signal modulation with capture- transition distortion from unmodulated stronger signal. (c) Detected weaker-signal modulation with capture-transition distortion from a stronger signal with 1000-cps tone modulation. (VI. FREQUENCY MODULATION) in the figures. The oscillograms of Fig. VI-7 illustrate the quality of weaker-signal reception when the signals are cochannel and the weaker-to-stronger signal-amplitude ratio is 0. 7. E. J. Baghdady References 1. R. H. Small, Single-channel, two-carrier FM multiplex system, Department of Electrical Engineering, M. I. T., June 1958. B. FM RECEIVER DESIGN S. M. Thesis, A study was made of the practical requirements in the design of FM receivers for suppressing cochannel interference through the use of cascaded narrow-band limiters and regenerative feedback limiters (1). The amplitude disturbances caused by the inter- ference before and after a stage of idealized narrow-band limiting were computed. Limiting threshold requirements that are sufficient to ensure continuous operation of the limiters were determined. A detailed study was made of the potentialities of the 6BN6 gated-beam limiter tube. Fifty 6BN6 tubes were used in this investigation for determining the quality of the limiting characteristic; the optimum values of bias and supply voltages; the limiting threshold; the amplitude of the plate-current fundamental component; and the sensitivity to power-supply and bias-voltage drifts. The extent of the nonlinear loading caused by limiter-input current and the design requirements that prevent nonlinear loading in a cascade of 6BN6 limiters were determined. From the study of the properties of the 6BN6 tube, the capture ratio of a receiver that utilizes a cascade of 6BN6 narrow-band limiters was found to have a determinable upper bound. Practical receiver design criteria were postulated and applied to the construction of an experimental FM receiver. The validity of some of the idealized theoretical models was checked by laboratory tests of the receiver. R. J. McLaughlin References 1. R. J. McLaughlin, A study of FM capture effects, S. M. Thesis, Electrical Engineering, M.I.T., June 1, 1958. Department of


