Experiment 1F-1 MEASUREMENTS IN THE CHEMISTRY LABORATORY I
advertisement
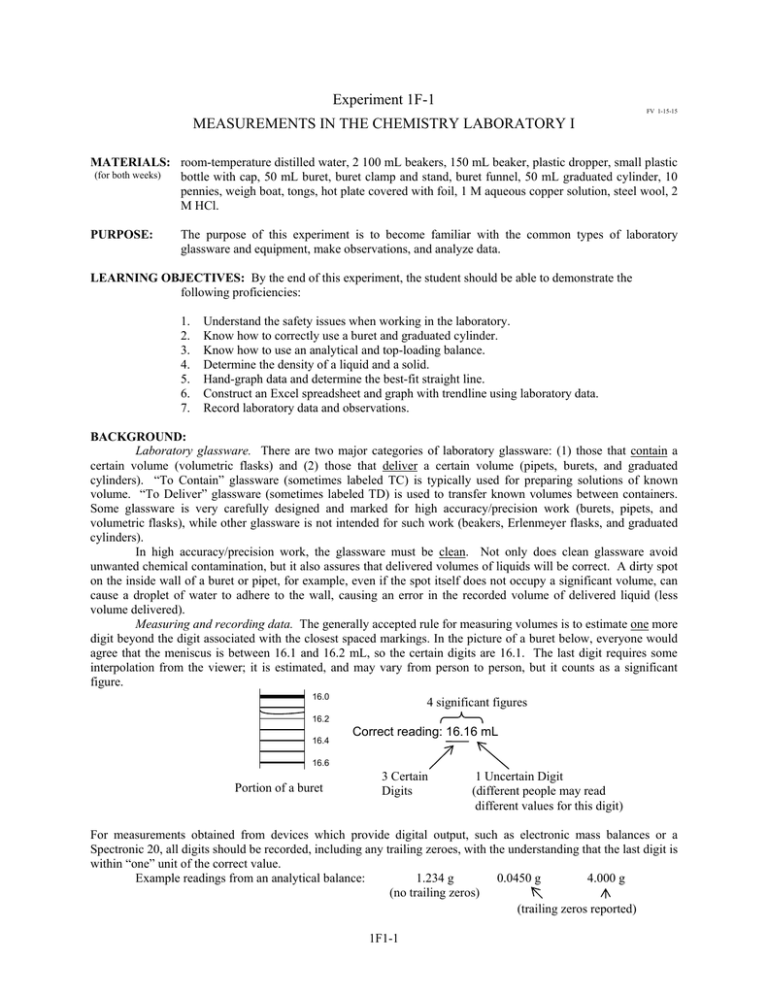
Experiment 1F-1 FV 1-15-15 MEASUREMENTS IN THE CHEMISTRY LABORATORY I MATERIALS: room-temperature distilled water, 2 100 mL beakers, 150 mL beaker, plastic dropper, small plastic (for both weeks) bottle with cap, 50 mL buret, buret clamp and stand, buret funnel, 50 mL graduated cylinder, 10 pennies, weigh boat, tongs, hot plate covered with foil, 1 M aqueous copper solution, steel wool, 2 M HCl. PURPOSE: The purpose of this experiment is to become familiar with the common types of laboratory glassware and equipment, make observations, and analyze data. LEARNING OBJECTIVES: By the end of this experiment, the student should be able to demonstrate the following proficiencies: 1. 2. 3. 4. 5. 6. 7. Understand the safety issues when working in the laboratory. Know how to correctly use a buret and graduated cylinder. Know how to use an analytical and top-loading balance. Determine the density of a liquid and a solid. Hand-graph data and determine the best-fit straight line. Construct an Excel spreadsheet and graph with trendline using laboratory data. Record laboratory data and observations. BACKGROUND: Laboratory glassware. There are two major categories of laboratory glassware: (1) those that contain a certain volume (volumetric flasks) and (2) those that deliver a certain volume (pipets, burets, and graduated cylinders). “To Contain” glassware (sometimes labeled TC) is typically used for preparing solutions of known volume. “To Deliver” glassware (sometimes labeled TD) is used to transfer known volumes between containers. Some glassware is very carefully designed and marked for high accuracy/precision work (burets, pipets, and volumetric flasks), while other glassware is not intended for such work (beakers, Erlenmeyer flasks, and graduated cylinders). In high accuracy/precision work, the glassware must be clean. Not only does clean glassware avoid unwanted chemical contamination, but it also assures that delivered volumes of liquids will be correct. A dirty spot on the inside wall of a buret or pipet, for example, even if the spot itself does not occupy a significant volume, can cause a droplet of water to adhere to the wall, causing an error in the recorded volume of delivered liquid (less volume delivered). Measuring and recording data. The generally accepted rule for measuring volumes is to estimate one more digit beyond the digit associated with the closest spaced markings. In the picture of a buret below, everyone would agree that the meniscus is between 16.1 and 16.2 mL, so the certain digits are 16.1. The last digit requires some interpolation from the viewer; it is estimated, and may vary from person to person, but it counts as a significant figure. 16.0 4 significant figures 16.2 16.4 Correct reading: 16.16 mL 16.6 Portion of a buret 3 Certain Digits 1 Uncertain Digit (different people may read different values for this digit) For measurements obtained from devices which provide digital output, such as electronic mass balances or a Spectronic 20, all digits should be recorded, including any trailing zeroes, with the understanding that the last digit is within “one” unit of the correct value. Example readings from an analytical balance: 1.234 g 0.0450 g 4.000 g (no trailing zeros) (trailing zeros reported) 1F1-1 Appendix E (from the Plebe lab website) gives more detailed information about equipment precision, including the various types of glassware to be investigated in this experiment. Properties. Any characteristic that can be used to describe or identify matter is called a property. Properties can be classified in a variety of ways. One common classification sorts properties as physical properties and chemical properties. Physical properties, like color or mass, are those which can be determined without changing the chemical makeup of the material. Weighing an object does not change it, so mass is a physical property. Chemical properties, on the other hand, rely on a chemical change. For example, iron reacts with oxygen to form rust. Rusting is a chemical property (and also a chemical reaction). Another common way to distinguish the properties of a substance is to classify them as extensive or intensive properties. For an extensive quantity, the value of the property depends on the amount of material. For example, the mass of an iceberg is much larger than the mass of an ice cube, because there is more ice in the larger sample. Therefore, mass is an extensive quantity. In contrast, the value of an intensive quantity does not depend on the amount of material. Temperature, for example, is an intensive quantity: an ice cube and an iceberg can both be at 0oC, regardless of their vastly different sizes. We will encounter many different quantities that can be used to characterize matter. The ability to classify such properties in these ways will be very useful. Density is a quantity that can be used to describe a sample, or even identify one from a limited set of possibilities. This property can be used for both pure materials and mixtures. Density is defined as the ratio of the mass divided by the volume. Like other properties of matter, density can be classified into two of the categories described above. You may already be able to classify density as a ‘physical’ or ‘chemical’ property. In this experiment, we will deduce whether density is an ‘extensive’ or ‘intensive’ property. Error Analysis. Appendix J is a basic introduction to the kinds of measurements most often encountered in the chemistry laboratory, along with methods for assessing the reliability of these measurements. Accuracy and precision are two different terms that are used to refer to the numbers that result from measurements. Accuracy refers to the agreement between a measured value and the true (or accepted) value. An accurate value is one that is very close to the true or accepted value. Precision refers to the degree of agreement among several measurements of the same quantity. Precision reflects the reproducibility of a given measurement. Precise values are very close to other values of the same measurement. For a set of data, the average may not be very accurate (far from its true value) but the data may be very precise (very similar values, reproducible). The goal of any experiment is to be both accurate and precise. When reporting results, two useful quantities are the average (or mean) and standard deviation of a set of data. The standard deviation represents the spread in the data. n n x i ( x i- x ) 2 i = 1 i =1 Average = mean = x = Standard deviation = s = n n -1 The variable n represents the number of measurements in a data set. A common way to compare a result to a true value (xt) is to determine the percent error: % error = (xi – xt) / xt 100 where xi is an experimental value, either an individual measurement or the average of a set of data. The % error can be a positive or negative value depending on whether xi is larger or smaller than the true value (xt). PRE-LAB: Before lab, complete the pre-lab exercises on page 1F1-6. Also read the safety agreement on page 1F1-7 and sign it. Bring the safety sheet, your pre-lab, your safety goggles, your laptop, and this handout with you to lab. 1F1-2 PROCEDURE: Safety: Safety for you and your classmates is the highest priority in the laboratory. Your instructor will discuss laboratory safety and give you a tour of the laboratory. Your signed safety sheet will also be collected. Equipment demonstrations: Your instructor will demonstrate how to use a top-loading balance and an analytical balance. You will use these balances frequently in lab. You will be working with a lab partner but both students should record the data individually (such as on page 1F1-4). When you are done collecting the data, start working on the data analysis and questions. Part A: Making Observations in the Laboratory 1. The common penny is composed of zinc metal coated with a thin layer of copper metal. You will observe reactions of these metals with strong acids. 2. Your instructor will perform these demonstrations in the hood but you must also wear your goggles. Observe the reactions of zinc with 7 M nitric acid (HNO3), and zinc with 7 M hydrochloric acid (HCl); then copper with 7 M nitric acid (HNO3), and copper with 7 M hydrochloric acid (HCl). 3. Record your observations on page 1F1-4. Part B: Determination of the Density of a Penny using Archimedes’ Principle 1. Obtain 10 dry pennies from the front of the room. All of these pennies range in year from 1983 to 2015. Very corroded or scratched pennies have been removed. If the pennies are wet, dry them with a paper towel. 2. Place an empty weigh boat on a top-loading balance. Tare the balance (i.e., set it to zero). 3. Add the 10 pennies (all together) to the weigh boat and record the total mass. 4. Place an empty weigh boat on an analytical balance. Tare the balance. 5. Add the 10 pennies to the weigh boat and record their total mass. Which balance provides more significant figures in the mass? 6. Fill a 50 mL graduated cylinder to about the 20 mL mark with room-temperature distilled water. Record the actual volume inside the graduated cylinder (should be read to the tenths place). 7. Carefully add your 10 pennies to the graduated cylinder without splashing or spilling the water. 8. Record the final volume of the water in the graduated cylinder with the proper number of significant figures. 9. Dry the pennies and return them to the container in the front of the room. Part C: Observing the Formation of a “Gold” Penny Each person can make one gold penny for himself or herself. 1. For each group, bring a beaker half-filled with distilled water and tongs to the instructor hood. 2. In the instructor hood, you will find a container with pennies that have been soaking in a solution of 3 M sodium hydroxide (NaOH) and zinc powder. Sodium hydroxide is caustic so use tongs to carefully remove two pennies (one for each lab partner) and place them directly into the beaker of water. Wash the pennies in the sink and dry them with a paper towel. Remove any stuck pieces of zinc powder from the penny. Rinse the tongs. Record your observations of this penny. 3. Set a hot plate to a setting of about 7 (for model Thermolyne Cimerac, or ~180°F). The heating surface of the hot plate should already be covered with foil. Have a beaker of water ready. 4. Using tongs, place the pennies in the center of the warm hot plate. Watch the pennies. In a few minutes, they should turn a yellowish-gold color due to a chemical reaction. Let the color develop over the entire penny (no more silver). At this point, with the tongs, carefully remove the pennies from the hot plate, and place them directly into the beaker of water (be careful, the pennies are hot!). Do not overheat the pennies as they will melt. Rinse and dry the pennies and record your observations. Do you think these pennies are really gold? You can keep the penny as a souvenir of chemistry lab. 5. Turn off the hot plate. Clean-up: Rinse all glassware and return them to your lab bench area (hood). Organize your lab bench area. Clean up any spills. At the end of any lab experiment, wash your hands to remove traces of chemicals. 1F1-3 Name ________________________________________ Section ______________________ Partner _______________________________________ Experiment 1F-1 MEASUREMENTS IN THE CHEMISTRY LABORATORY I DATA SHEET: Report all values with units and the proper number of significant figures. Part A: Making Observations in the Laboratory Observations – describe what happened Did a chemical reaction occur? 1. Zn and HNO3 2. Zn and HCl 3. Cu and HNO3 4. Cu and HCl Part B: Determination of the Density of a Penny using Archimedes’ Principle Mass of 10 pennies using the top-loading balance = ________________________ Mass of 10 pennies using the analytical balance = ________________________ Of the 2 masses above, circle the one with the largest number of significant figures. More significant figures mean a more precise (sensitive) value. Initial Volume in Graduated Cylinder = ________________________ Final Volume after adding the pennies = ________________________ Volume of 10 pennies = ________________________ (Watch sig figs.) Density of 10 pennies = ________________________ (using mass from top-loading balance) (Record the units! How many sig figs? Show your work below. Density of 10 pennies = ________________________ (using mass from analytical balance) (Record the units! How many sig figs?) Did the number of significant figures in the mass matter in the calculation of the density value? ______________ Part C: Observing the Formation of a “Gold” Penny Describe your “gold penny. Is the coating permanent? Did a chemical reaction occur? Explain why or why not. 1F1-4 DATA ANALYSIS AND QUESTIONS Part A: Making Observations in the Laboratory Pennies minted after 1982 are composed of zinc coated with a thin layer of copper. If you put a regular, post-1982 penny in 7 M HCl, what would happen to it? If you put a regular, post-1982 penny in 7 M HNO3, what would happen to it? Go to your instructor to observe another “special” penny. Explain how you think that was made (what solution was the penny soaked in)? Part B: Determination of the Density of a Penny using Archimedes’ Principle Explain why the volume of the graduated cylinder you used was read to the tenths place. You determined the density of the 10 pennies. Record that density here: ___________________________ What is the density of 1 penny? (Will it be different for 1 vs. 10 pennies?) Density of 1 penny = ________________________ (report with units and proper sig figs) Is density an intensive or extensive property? ______________________________ Part C: Observing the Formation of a “Gold” Penny 1. a. The mass of a penny can vary based on the penny composition. For example, from 1943 to 1982, pennies were composed of 95% Cu and 5% Zn with an approximate mass of 3.1 g per penny and density of 8.84 g/mL. After 1982, due to the rising cost of copper, the composition was changed to 2.4% Cu and 97.6% Zn with an approximate mass of 2.5 g (lighter pennies). Given the composition of the post-1982 penny (which you studied) and the densities of the pure metals below, determine the expected density of a post-1982 penny. Report your value with the proper significant figures. (Hint: you’ll need a ‘weighted’ average.) Cu density = 8.93 g/mL Zn density = 7.13 g/mL b. Using your expected density in part a as the “true” value, determine the % error in comparison to your experimentally determined value. Show your work. Consider significant figures. 1F1-5 You will be using Microsoft Excel next week, so if you’ve never used it before, complete the Excel Tutorial at: http://www.usna.edu/ChemDept/plebeChem/tutorials.php Name ________________________________________ Section ______________________ Experiment 1F-1 MEASUREMENTS IN THE CHEMISTRY LABORATORY I PRE-LAB EXERCISES Complete this page prior to attending lab. 1. Based on the targets, which would be considered inaccurate but precise? Circle your choice. 2. Given the following 3 values: 2.5 3.3 4.2 a. Determine the average (or mean). Average = ______________ b. Determine the standard deviation. Standard Deviation = ____________ To calculate averages and standard deviations with your TI-nspire CX CAS calculator: 1. 3. 4. 5. 7. 3. Press Home,on key. 2. Scroll and select Lists & Spreadsheets. Under column A, type in your data (one per cell). Press enter between values. Press Menu. 5. Select: Statistics Stat Calculations One-Variable Statistics Press OK (to Num List = 1). 6. Press OK (to X1 list = a[]). Values will be displayed. x is the average. sx is the standard deviation. Read the volume in this buret and report it with the correct number of significant figures. Buret volume = ______________________ mL 4. What is Archimedes’ Principle? Search the web. 5. To the right is a picture of a volumetric flask. Is it a TC (to contain) or TD (to deliver) piece of glassware? 6. TC TD Review the concept of significant figures in your textbook. a. How many significant figures do the following numbers contain? 0.0129 has _________ significant figures. b. 2.0100 has _________ significant figures. Report these numbers to 3 significant figures. 2.996 ________________ c. 8000 _________________________ Perform this operation and report the answer with the proper number of significant figures. 9.05 12.00 = _____________________ 7. Circle the chemical property. Mass 1F1-6 Flammability Color CHEMISTRY LABORATORY SAFETY AGREEMENT Before working in the chemistry laboratory, read carefully the safety precautions and techniques for handling chemicals described in http://www.usna.edu/ChemDept/_files/documents/manual/SAFETY.pdf. Give this agreement, signed and dated, to your laboratory instructor on the first day of lab. When you are in the laboratory, THINK about what you are doing at all times. 1. 2. 3. 4. 5. 6. 7. 8. 9. 10. 11. 12. 13. 14. 15. 16. Always wear approved chemical splash goggles and lab aprons in the laboratory. Do not attempt any unauthorized experiments. Follow directions carefully. Know the location and operation of safety equipment. Bring only necessary materials into lab. Book bags, jackets, covers, etc., are to be left in the hallway. Never work alone in the laboratory. Never eat or drink in the laboratory. Do not bring water bottles into the laboratory. Use the fume hood for experiments. Keep lab stools at the tables, NOT by the hoods. Keep your work area uncluttered. Clean up your area before leaving lab. Lower the hood sashes. Use only equipment that is in good condition. Dispose of waste and excess materials according to your laboratory instructor's directions. No horseplay in the laboratory. Do not sit or lean on laboratory work surfaces. Handle chemicals with caution. (a) Read labels carefully. (b) Use only the amount required. (c) Leave reagent containers in their proper places. (d) Clean up all spills immediately. (e) Label all chemical containers. Thoroughly wash your hands any time you leave the laboratory. Immediately report all accidents and physical/chemical injuries, no matter how minor, to your laboratory instructor. Be ready to take immediate action as needed to assist any injured classmate. Do not leave the laboratory without your instructor’s approval. I have carefully read all the safety precautions on the pages at the website above and recognize that it is my responsibility to observe them throughout my chemistry course. Name __________________________ Signature ________________________ Course _________________________ Section __________________________ Instructor _______________________ Date ____________________________ 1F1-7
