Prof. C. H. Perry Jeanne H. Fertel
advertisement

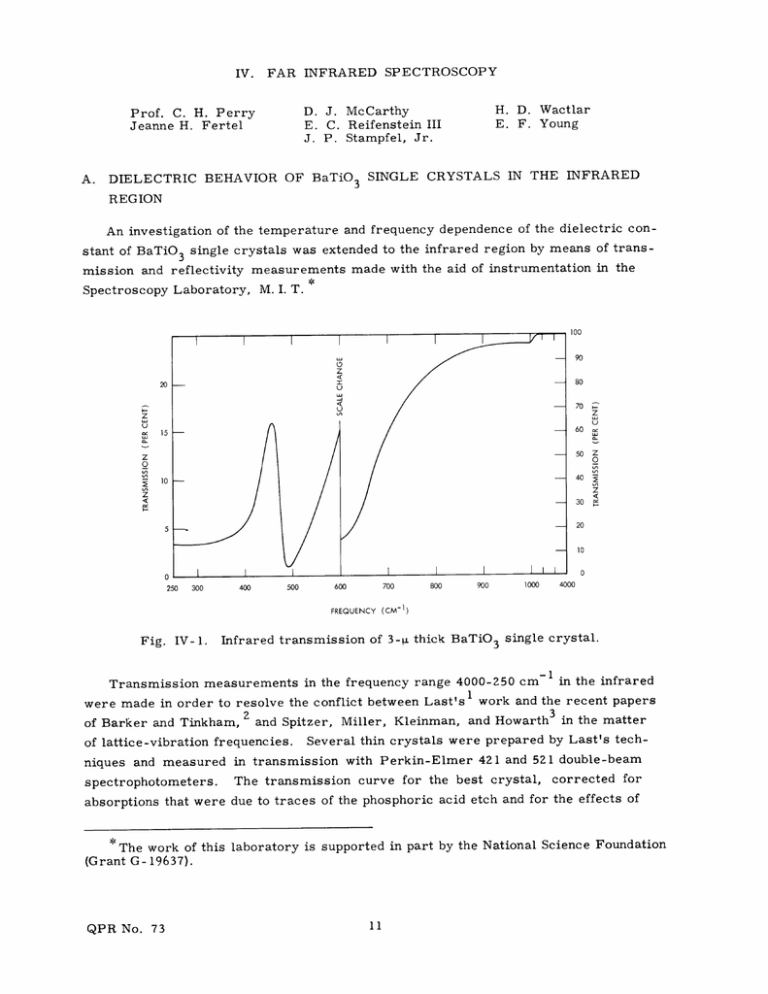
IV. FAR INFRARED SPECTROSCOPY A. H. D. Wactlar E. F. Young D. J. McCarthy E. C. Reifenstein III J. P. Stampfel, Jr. Prof. C. H. Perry Jeanne H. Fertel DIELECTRIC BEHAVIOR OF BaTiO 3 SINGLE CRYSTALS IN THE INFRARED REGION An investigation of the temperature and frequency dependence of the dielectric constant of BaTiO 3 single crystals was extended to the infrared region by means of transmission and reflectivity measurements made with the aid of instrumentation in the Spectroscopy Laboratory, M. I. T.* - 90 - 80 70 - Z u 60 - 50 - 40 - 30 - 20 Z O 0 Z 10 300 400 500 600 FREQUENCY (CM Fig. IV- 1. 800 700 -1 900 1000 4000 ) Infrared transmission of 3-4 thick BaTiO3 single crystal. -1l - 1 in the infrared Transmission measurements in the frequency range 4000-250 cm were made in order to resolve the conflict between Last'sl work and the recent papers 3 of Barker and Tinkham, 2 and Spitzer, Miller, Kleinman, and Howarth in the matter of lattice-vibration frequencies. Several thin crystals were prepared by Last's tech- niques and measured in transmission with Perkin-Elmer 421 and 521 double-beam The transmission curve for the best crystal, corrected for spectrophotometers. absorptions that were due to traces of the phosphoric acid etch and for the effects of The work of this laboratory is supported in part by the National Science Foundation (Grant G-19637). QPR No. 73 o -4 100 90- 80 w 7060- 50_-24 0 40- oC 127 °C -J u, 30w - 0 150 C 2010- 100 120 140 150 160 170 180 190 200 FREQUENCY Fig. IV-2. 300 400 500 600 700 (CM- ') Infrared reflection of single-domain BaTiO 3 crystals. 800 900 1000 4000 (IV. FAR INFRARED SPECTROSCOPY) stray radiation in the instrument, is shown in Fig. IV- 1. Contrary to Last's results, -1 region; this shows that the second there is no rise in transmission in the 400-250 cm band reported by him at 340 cm-1 is actually at the lower frequency 183 cm-1 , as found by Spitzer et al. 3 and the present writer. The reflectivity of polarized BaTiO3 single crystals was measured in the region 4 -1 -1 with the facilities described previously. 4 Samples were to 35 cm from 1000 cm prepared by etching large "butterfly" crystals in hot phosphoric acid to remove the surface layer, and then polarizing them to c-domain plates.5 To obtain a sufficiently large area, two polarized crystals were butted together and then cast into an epoxy resin block so as to maintain the plane surface. The composite reflectivity curve measured for many samples on a variety of instruThe angle of incidence is 450 ments and at three temperatures is given in Fig. IV-2. and 100 at higher frequencies. to Z50 cm -1, -1 at 491 and 182 cm-1 from 100 cm- The lattice band at 180 cm - I Resonances are observed occurs at about the same place as that reported by Spitzer et al. 3 It has a slight temperature dependence which is easily explainable by ordinary broadening with increase in temperature and by the change in lattice symmetry above and below the Curie point. No anomalous change in the frequency or intensity of this band is observed as one traverses the Curie point. Accurate measurements in the submillimeter and millimeter regions indicate a third resonance at approximately 12 cm-1 which is responsible for the ferroelectric state in BaTiO . 3 J. M. Ballantyne (Dr. Joseph M. Ballantyne, Research Associate in the Department of Electrical Engineering, has been using the equipment of our group in the Spectroscopy Laboratory, M. I. T.) References J. 2. A. S. Barker and M. 3. 126, T. Last, Phys. Rev. 1. W. G. Spitzer, R. 1710 (1962). 105, 1740 (1957). Tinkham, Phys. Rev. 125, 1529 (1962). C. Miller, D. A. Kleinman, and L. E. Howarth, Phys. Rev. 4. C. H. Perry, Quarterly Progress Report No. 70, Research Laboratory of Electronics, M. I. T., July 15, 1963, p. 19. 5. J. M. Ballantyne, Quarterly Progress Report No. XXXII, Laboratory for Insulation Research, M. I. T., 1963, p. 5. 6. J. M. Ballantyne, Ph. D. Thesis, Department of Electrical Engineering, M. I. T., February 1964. QPR No. 73


