Human Capacity 2011 Special Education Technology Integration Specialist
advertisement
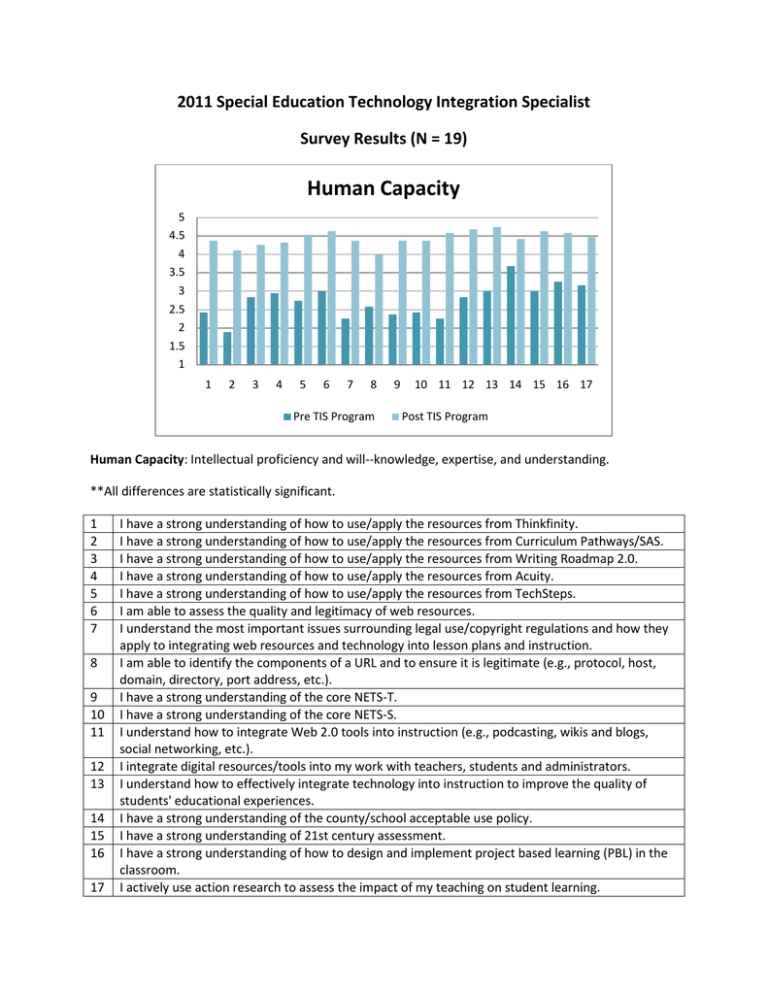
2011 Special Education Technology Integration Specialist Survey Results (N = 19) Human Capacity 5 4.5 4 3.5 3 2.5 2 1.5 1 1 2 3 4 5 6 7 8 Pre TIS Program 9 10 11 12 13 14 15 16 17 Post TIS Program Human Capacity: Intellectual proficiency and will--knowledge, expertise, and understanding. **All differences are statistically significant. 1 2 3 4 5 6 7 8 9 10 11 12 13 14 15 16 17 I have a strong understanding of how to use/apply the resources from Thinkfinity. I have a strong understanding of how to use/apply the resources from Curriculum Pathways/SAS. I have a strong understanding of how to use/apply the resources from Writing Roadmap 2.0. I have a strong understanding of how to use/apply the resources from Acuity. I have a strong understanding of how to use/apply the resources from TechSteps. I am able to assess the quality and legitimacy of web resources. I understand the most important issues surrounding legal use/copyright regulations and how they apply to integrating web resources and technology into lesson plans and instruction. I am able to identify the components of a URL and to ensure it is legitimate (e.g., protocol, host, domain, directory, port address, etc.). I have a strong understanding of the core NETS-T. I have a strong understanding of the core NETS-S. I understand how to integrate Web 2.0 tools into instruction (e.g., podcasting, wikis and blogs, social networking, etc.). I integrate digital resources/tools into my work with teachers, students and administrators. I understand how to effectively integrate technology into instruction to improve the quality of students' educational experiences. I have a strong understanding of the county/school acceptable use policy. I have a strong understanding of 21st century assessment. I have a strong understanding of how to design and implement project based learning (PBL) in the classroom. I actively use action research to assess the impact of my teaching on student learning. Organizational Capacity 5 4.5 4 3.5 3 2.5 2 1.5 1 18 19 Pre TIS Program 20 21 22 Post TIS Program Organizational Capacity: Interaction, collaboration and communication among individuals in the system. **All differences are statistically significant. 18 19 20 21 22 I model lessons that integrate technology for other teachers in the school. I collaborate with others within the school to effectively integrate technology into instruction. I serve as a resource to other teachers regarding the effective use of technology in the school. I can effectively work with others to assess their learning and information needs (e.g., other teachers, students, administrators, etc.). I have an ongoing dialogue with other staff members at the school about technology issues and how they can be addressed. Structural Capacity 5 4.5 4 3.5 3 2.5 2 1.5 1 23 24 25 26 27 28 29 30 31 32 33 34 35 36 37 38 39 Pre TIS Program Post TIS Program Structural Capacity: The elements of the system which exist independent of the people who use those elements (e.g., policies, procedures and formalized practices). **All differences are statistically significant. 23 24 25 26 27 28 29 30 31 32 33 34 35 36 37 38 39 The school has set a time and place where staff meet in professional communities of practice to discuss how to effectively integrate technology into instruction. Teachers at the school have time to co-plan and/or co-teach lessons that integrate technology into instruction. Staff at the school understand the acceptable use policy. Staff at the school understand key concepts and best practices regarding web literacy. Staff at the school understand the most important issues surrounding legal use/copyright regulations and how they relate to integrating web resources and technology into lesson plans and instruction. Staff at the school are familiar with the technology components of the school's strategic plan. The school has policies and procedures in place that support the use of PBL. The school has policies and procedures in place that support the use of technology resources (thinkfinity, acuity, writing roadmap, etc.). Staff at the school regularly use Thinkfinity and/or Curriculum Pathways (SAS) as a resource in the classroom. Staff at the school regularly use writing roadmap 2.0 or another online writing program as a formative assessment of student writing. The school has a plan in place to support the implementation of TechSteps. Staff at the school regularly use TechSteps as part of their core content instruction. Staff at the school understand the core NETS-T. Staff at the school understand the core NETS-S. Staff at the school understand West Virginia's 21st centure skills and tools. Staff at the school use Web 2.0 tools for collaboration and instruction. Staff at the school frequently integrate digital resources/tools in their teaching. Material Capacity 5.5 5 4.5 4 3.5 3 2.5 2 1.5 1 40 41 Pre TIS Program 42 43 44 Post TIS Program Material Capacity: Fiscal and/or other material supports available to the people in the system. **All differences are statistically significant. 40 41 42 43 44 I have access to a variety of high quality technology resources at my school (e.g., computer, digital camera, whiteboard, etc.). I participated in a variety of professional development about integrating technology resources into instruction. I feel I am able to direct staff in my school toward high quality technology resources that are relevant to their information needs. I have the ability to develop useful technology resources for my school that address our information needs. I know where to find useful and high quality technology resources that can be integrated into instruction. Standardized Indices 5 3.74 4 3 4.68 4.63 4.43 3.05 3 2.81 2.74 2 1 Human Capacity Index Organizational Capacity Index Pre TIS Program Structural Capacity Index Material Capacity Index Post TIS Program *Each index is a standardized measure based on multiple items. The table below displays the reliability coefficients for each scale during the preand post-test administrations (Note: an α value of .70 or higher is considered highly reliable). ** All differences are statistically significant Index Human Capacity Index Organizational Capacity Index Structural Capacity Index Material Capacity Index Items Included 1 – 17 18 – 22 23 – 39 40 – 44 Pre-Test α .916 .929 .925 .753 Post-Test α .847 .910 .907 .533 Effect Size Effect Size by Item 3.5 3 2.5 2 1.5 1 0.5 0 1 2 3 4 5 6 7 8 9 10 11 12 13 14 15 16 17 18 19 20 21 22 23 24 25 26 27 28 29 30 31 32 33 34 35 36 37 38 39 40 41 42 43 44 Survey Item Effect Size Effect size interpretations are as follows: negligible effect (>= -0.15 and <.15) small effect (>=.15 and <.40) medium effect (>=.40 and <.75) large effect (>=.75 and <1.10) very large effect (>=1.10 and higher) ITEM 1 2 3 4 5 6 ES ITEM 2.4 7 3.09 8 1.42 9 1.57 10 1.78 11 1.88 12 ES ITEM 2.65 13 1.49 14 2.58 15 2.16 16 2.69 17 2.2 18 ES ITEM 2.12 19 1.28 20 2.12 21 1.65 22 1.61 23 1.99 24 ES Item 2.15 25 1.81 26 1.53 27 2.06 28 0.7 29 0.56 30 ES 0.79 0.87 1.27 1.14 0.71 0.81 ITEM 31 32 33 34 35 36 ES 0.94 0.79 0.66 0.35 0.74 0.87 ITEM 37 38 39 40 41 42 ES 0.69 0.85 0.91 1.82 1.2 1.6 ITEM 43 44 ES 2.56 2.49 Effect Size by Capacity Area 3.5 3.19 3 Effect Size 2.5 2.72 2.19 2 1.5 1.15 1 0.5 0 Human Organizational Structural Capacity Indices Effect Size Effect size interpretations are as follows: negligible effect (>= -0.15 and <.15) small effect (>=.15 and <.40) medium effect (>=.40 and <.75) large effect (>=.75 and <1.10) very large effect (>=1.10 and higher) Material
