Briefing Document Impact for WorkFirst Participants of Reaching the ‘Tipping Point’
advertisement

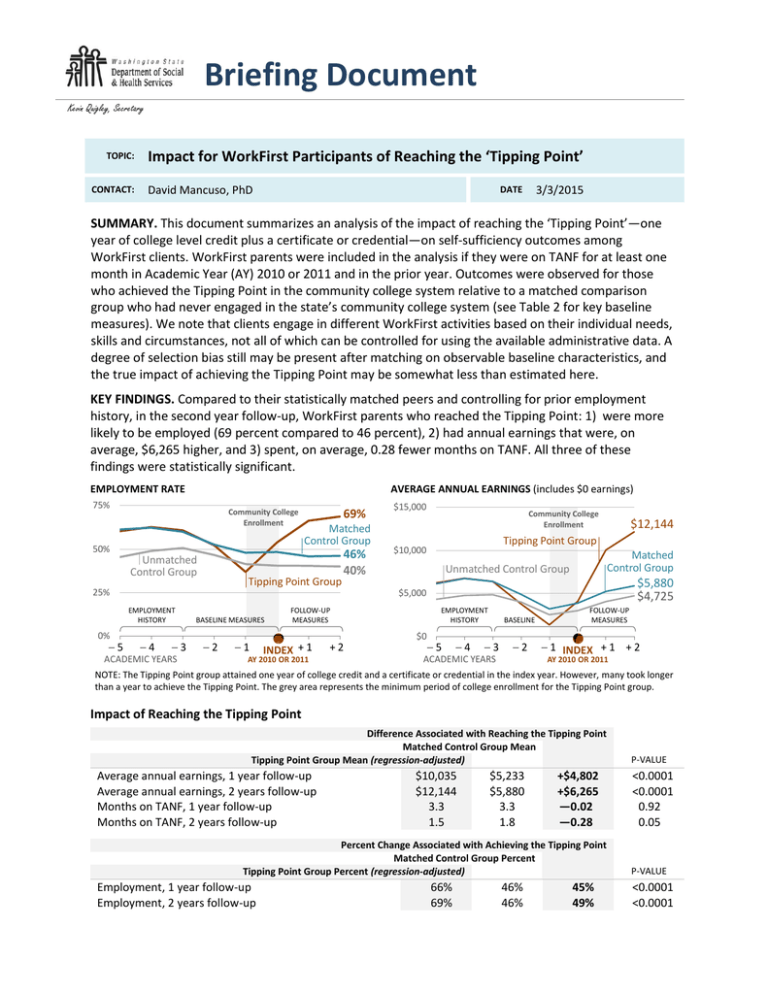
Briefing Document Kevin Quigley, Secretary TOPIC: CONTACT: Impact for WorkFirst Participants of Reaching the ‘Tipping Point’ David Mancuso, PhD 3/3/2015 DATE SUMMARY. This document summarizes an analysis of the impact of reaching the ‘Tipping Point’—one year of college level credit plus a certificate or credential—on self-sufficiency outcomes among WorkFirst clients. WorkFirst parents were included in the analysis if they were on TANF for at least one month in Academic Year (AY) 2010 or 2011 and in the prior year. Outcomes were observed for those who achieved the Tipping Point in the community college system relative to a matched comparison group who had never engaged in the state’s community college system (see Table 2 for key baseline measures). We note that clients engage in different WorkFirst activities based on their individual needs, skills and circumstances, not all of which can be controlled for using the available administrative data. A degree of selection bias still may be present after matching on observable baseline characteristics, and the true impact of achieving the Tipping Point may be somewhat less than estimated here. KEY FINDINGS. Compared to their statistically matched peers and controlling for prior employment history, in the second year follow-up, WorkFirst parents who reached the Tipping Point: 1) were more likely to be employed (69 percent compared to 46 percent), 2) had annual earnings that were, on average, $6,265 higher, and 3) spent, on average, 0.28 fewer months on TANF. All three of these findings were statistically significant. EMPLOYMENT RATE AVERAGE ANNUAL EARNINGS (includes $0 earnings) 75% Community College Enrollment 50% Unmatched Control Group 46% 40% $15,000 Community College Enrollment $12,144 Tipping Point Group $10,000 Matched Control Group Unmatched Control Group $5,880 $4,725 $5,000 EMPLOYMENT HISTORY 5 Matched Control Group Tipping Point Group 25% 0% 69% 4 3 ACADEMIC YEARS BASELINE MEASURES 2 FOLLOW-UP MEASURES EMPLOYMENT HISTORY $0 1 INDEX + 1 AY 2010 OR 2011 +2 5 4 BASELINE 3 2 ACADEMIC YEARS FOLLOW-UP MEASURES 1 INDEX + 1 + 2 AY 2010 OR 2011 NOTE: The Tipping Point group attained one year of college credit and a certificate or credential in the index year. However, many took longer than a year to achieve the Tipping Point. The grey area represents the minimum period of college enrollment for the Tipping Point group. Impact of Reaching the Tipping Point Difference Associated with Reaching the Tipping Point Matched Control Group Mean Tipping Point Group Mean (regression-adjusted) Average annual earnings, 1 year follow-up Average annual earnings, 2 years follow-up Months on TANF, 1 year follow-up Months on TANF, 2 years follow-up $10,035 $12,144 3.3 1.5 $5,233 $5,880 3.3 1.8 +$4,802 +$6,265 —0.02 —0.28 Percent Change Associated with Achieving the Tipping Point Matched Control Group Percent Tipping Point Group Percent (regression-adjusted) Employment, 1 year follow-up Employment, 2 years follow-up 66% 69% 46% 46% 45% 49% P-VALUE <0.0001 <0.0001 0.92 0.05 P-VALUE <0.0001 <0.0001 Baseline Characteristics of Tipping Point and Control Groups, Pre- and Post-Matching Female White only, non-Hispanic Hispanic African American American Indian Asian/Pacific Islander Age 18 - 24 Age 25 - 34 Age 35 - 44 Age 45 - 54 Age 55+ Less than high school (according to ACES) High school graduate (according to ACES) Some post-secondary education (according to ACES) Associate’s degree or above (according to ACES) Average number of children Youngest child under 1 year-old Youngest child age 1 - 2 Youngest child age 3 - 5 Youngest child age 6 - 11 Youngest child age 12+ Two parent household County unemployment rate County urbanicity: rural County urbanicity: high density urban County urbanicity: med density urban County urbanicity: low density urban Homeless/unsheltered in prior 24 months Homeless without housing in prior 24 months Family violence identified in CE Financial management issues identified in CE Criminal background issue identified in CE School challenge identified in CE Employability challenge identified in CE Pregnant or caring for others identified in CE Chronic illness risk score at or above 1 Alcohol/drug treatment need in prior 24 months Mental health need in prior 24 months Ever incarcerated in Dept. of Corrections facility Arrested in prior 24 months Conviction in prior 24 months rd Average months on TANF, 3 year prior to index Substance abuse treatment (WF activity), prior 3 years Family violence resolution (WF activity), prior 3 years Mental health services (WF activity), prior 3 years DSHS Briefing Document Tipping Point 1:1 Matched Control Group Unmatched Control Group TOTAL = 1,202 TOTAL = 1,202 TOTAL = 52,391 79% 57% 11% 20% 5% 7% 19% 48% 25% 6% 1% 11% 59% 28% 3% 1.88 11% 33% 24% 20% 11% 25% 9.7% 0% 50% 31% 19% 17% 6% 2% 2% 1% 3% 7% 2% 41% 14% 43% 3% 11% 17% 2.9 7% 8% 11% 79% 56% 10% 19% 5% 8% 19% 48% 25% 6% 1% 9% 61% 27% 2% 1.87 12% 34% 24% 19% 11% 27% 9.7% 1% 48% 32% 20% 15% 7% 2% 2% 2% 3% 6% 2% 43% 14% 42% 3% 10% 16% 2.9 7% 8% 11% 77% 54% 14% 14% 9% 9% 28% 38% 22% 9% 1% 32% 53% 12% 2% 1.81 22% 25% 16% 18% 14% 30% 9.8% 1% 39% 36% 24% 21% 12% 3% 4% 3% 6% 13% 6% 51% 21% 42% 3% 21% 25% 2.5 7% 6% 14% Page | 2


