Document 11011131
advertisement
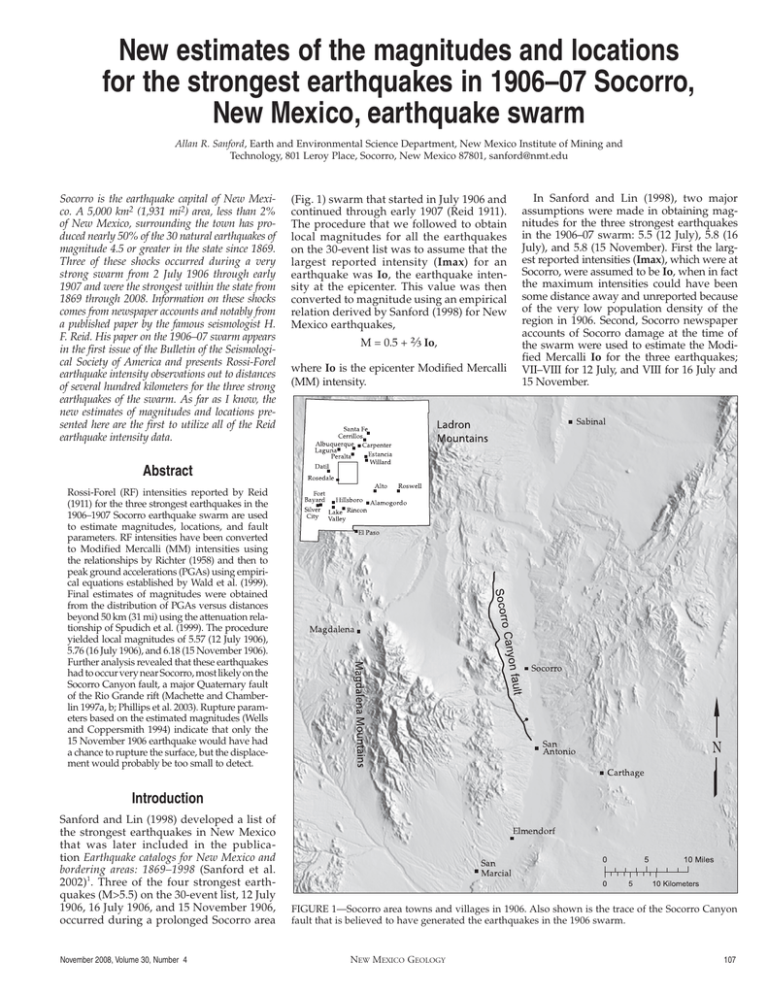
New estimates of the magnitudes and locations for the strongest earthquakes in 1906–07 Socorro, New Mexico, earthquake swarm Allan R. Sanford, Earth and Environmental Science Department, New Mexico Institute of Mining and Technology, 801 Leroy Place, Socorro, New Mexico 87801, sanford@nmt.edu Socorro is the earthquake capital of New Mexico. A 5,000 km2 (1,931 mi2) area, less than 2% of New Mexico, surrounding the town has produced nearly 50% of the 30 natural earthquakes of magnitude 4.5 or greater in the state since 1869. Three of these shocks occurred during a very strong swarm from 2 July 1906 through early 1907 and were the strongest within the state from 1869 through 2008. Information on these shocks comes from newspaper accounts and notably from a published paper by the famous seismologist H. F. Reid. His paper on the 1906–07 swarm appears in the first issue of the Bulletin of the Seismological Society of America and presents Rossi-Forel earthquake intensity observations out to distances of several hundred kilometers for the three strong earthquakes of the swarm. As far as I know, the new estimates of magnitudes and locations presented here are the first to utilize all of the Reid earthquake intensity data. (Fig. 1) swarm that started in July 1906 and continued through early 1907 (Reid 1911). The procedure that we followed to obtain local magnitudes for all the earthquakes on the 30-event list was to assume that the largest reported intensity (Imax) for an earthquake was Io, the earthquake intensity at the epicenter. This value was then converted to magnitude using an empirical relation derived by Sanford (1998) for New Mexico earthquakes, M = 0.5 + 2/3 Io, where Io is the epicenter Modified Mercalli (MM) intensity. In Sanford and Lin (1998), two major assumptions were made in obtaining magnitudes for the three strongest earthquakes in the 1906–07 swarm: 5.5 (12 July), 5.8 (16 July), and 5.8 (15 November). First the largest reported intensities (Imax), which were at Socorro, were assumed to be Io, when in fact the maximum intensities could have been some distance away and unreported because of the very low population density of the region in 1906. Second, Socorro newspaper accounts of Socorro damage at the time of the swarm were used to estimate the Modified Mercalli Io for the three earthquakes; VII–VIII for 12 July, and VIII for 16 July and 15 November. Abstract Rossi-Forel (RF) intensities reported by Reid (1911) for the three strongest earthquakes in the 1906–1907 Socorro earthquake swarm are used to estimate magnitudes, locations, and fault parameters. RF intensities have been converted to Modified Mercalli (MM) intensities using the relationships by Richter (1958) and then to peak ground accelerations (PGAs) using empirical equations established by Wald et al. (1999). Final estimates of magnitudes were obtained from the distribution of PGAs versus distances beyond 50 km (31 mi) using the attenuation relationship of Spudich et al. (1999). The procedure yielded local magnitudes of 5.57 (12 July 1906), 5.76 (16 July 1906), and 6.18 (15 November 1906). Further analysis revealed that these earthquakes had to occur very near Socorro, most likely on the Socorro Canyon fault, a major Quaternary fault of the Rio Grande rift (Machette and Chamberlin 1997a, b; Phillips et al. 2003). Rupture parameters based on the estimated magnitudes (Wells and Coppersmith 1994) indicate that only the 15 November 1906 earthquake would have had a chance to rupture the surface, but the displacement would probably be too small to detect. Introduction Sanford and Lin (1998) developed a list of the strongest earthquakes in New Mexico that was later included in the publication Earthquake catalogs for New Mexico and bordering areas: 1869–1998 (Sanford et al. 2002)1. Three of the four strongest earthquakes (M>5.5) on the 30-event list, 12 July 1906, 16 July 1906, and 15 November 1906, occurred during a prolonged Socorro area November 2008, Volume 30, Number 4 FIGURE 1—Socorro area towns and villages in 1906. Also shown is the trace of the Socorro Canyon fault that is believed to have generated the earthquakes in the 1906 swarm. New Mexico Geology 107 TABLE 1—12 July 1906: locations, observed intensities, distances from Socorro, peak ground accelerations (PGAs), and magnitudes. Locations greater than 50 km (31 mi) from Socorro are designated with a gray background. Location1 Rossi-Forel intensity Modified Mecalli intensity2 Distance3 from Socorro km PGA (g)4 Magnitude5 (mi) Socorro VIII VII 1/4 0 0 0.276 5.72 San Antonio VII–VIII VI 3/4 20 (12.5) 0.202 7.27 Carthage VI–VII VI 26 (16) 0.126 6.85 Elmendorf VI–VII VI 36 (22.5) 0.126 7.46 San Marcial VI V 1/2 41 (25.5) 0.092 7.11 Rosedale IV? III 3/4 55 (34) 0.018 4.59 Alamogordo III–IV III 1/3 155 (96.5) 0.012 5.87 Lake Valley III–IV III 1/3 161 (100) 0.012 5.95 Silver City III–IV III 1/3 192 (119.5) 0.012 6.29 Albuquerque III III 115 (71.5) 0.0083 4.58 El Paso III III 250 (155.5) 0.0083 6.12 1 2 Locations and Rossi-Forel intensities from Reid (1911). Rossi-Forel conversion to Modified Mercalli intensity from Richter (1958). 3 Distances from Socorro to other reporting localities from New Mexico Aeronautical Chart (H. M. Gousha Company) and Julyan (1996). 4 Conversion of Modified Mercalli intensity to PGA from Wald et al. (1999). 5 Magnitude required to produce the observed intensity at the listed distance from Spudich et al. (1999). TABLE 2—16 July 1906: locations, observed intensities, distances from Socorro, peak ground accelerations (PGAs), and magnitudes. Locations greater than 50 km (31 mi) from Socorro are designated with a gray background. Location1 Rossi-Forel intensity Modified Mecalli intensity2 Distance3 from Socorro km PGA (g)4 Magnitude5 New magnitude estimates (mi) Socorro VIII VII 1/4 0 0 0.276 5.72 San Antonio VII–VIII VI 3/4 20 (12.5) 0.202 7.27 Sabinal V–VI V 48 (30) 0.067 6.82 Rosedale V IV 1/2 55 (34) 0.040 6.11 Hillsboro IV–V IV 140 (87) 0.023 6.90 Peralta IV III 3/4 85 (53) 0.018 5.45 Datil IV? III 3/4 89 (55.5) 0.018 5.54 Albuquerque III–IV III 1/3 115 (71.5) 0.012 5.27 Rincon III–IV III 1/3 151 (94) 0.012 5.82 El Paso III–IV III 1/3 250 (155.5) 0.012 6.82 Alto III III 138 (86) 0.0083 4.94 Lake Valley III III 161 (100) 0.0083 5.26 Fort Bayard III III 184 (114.5) 0.0083 5.51 1 2 3 Locations and Rossi-Forel intensities from Reid (1911). Rossi-Forel conversion to Modified Mercalli intensity from Richter (1958). Distances from Socorro to other reporting localities from New Mexico Aeronautical Chart (H. M. Gousha Company) and Julyan (1996). 4 Conversion of Modified Mercalli intensity to PGA from Wald et al. (1999). 5 Magnitude required to produce the observed intensity at the listed distance from Spudich et al. (1999). Reid intensity data Reid (1911) presents Rossi-Forel (RF) intensities for the three strongest earthquakes of the swarm out to distances of several hundred kilometers. In Tables 1, 2, and 3, Reid’s RF intensities for the three quakes are converted to MM intensities (Richter 108 1958) and listed for locations out to several hundred kilometers. Empirical formulas by Wald et al. (1999) are used here to estimate peak ground accelerations (PGAs) for the listed MM intensities. log PGA = 0.273 (Imm + 1.66) V<Imm < VIII log PGA = 0.454 (Imm – 1.00) Imm < V New Mexico Geology Note that the estimated PGAs are based on intensity observations that have large uncertainties. Intensities (see Appendix) are assigned on the basis of how people judge the strength of ground motion and damage to structures. The former can be highly subjective and the latter dependent on the quality of construction. The formulas developed by Wald et al. (1999) for estimating Modified Mercalli Intensity (MMI) from observed PGA have an uncertainty of one MMI unit. The inverse, that is estimating PGA from observed MMI also has a large uncertainty, for example for a reported MMI of V, the mean PGA is ~70 cm/s/s with plus and minus one sigma values of ~150 cm/s/s and 30 cm/s/s. Table 4 lists the RF intensities reported at the same locations for the three earthquakes. A comparison between these data indicates that the 15 November and 16 July quakes were stronger than the shock on 12 July. However, it is not clear from the data in Table 4 whether the 15 November event is stronger than the one on 16 July. Reid (1911) ranks the earthquakes from strongest to weakest: 15 November, 16 July, and 12 July. However, Reid reports RF intensity VIII at Socorro for all three earthquakes which suggests that the epicenter distance from Socorro is least for 12 July and greatest for 15 November. Figures 2, 3, and 4 show the calculated PGAs versus distance for the three earthquakes. Magnitude can be estimated from the decrease in PGA with distance: a function of magnitude, geometrical spreading, crustal absorption, focal depth, and site effects. For this study, the attenuation relation of Spudich et al. (1999) was adopted because it provided estimates of ground motion versus distance for an extensional tectonic regime, an appropriate choice for the Socorro area located within the Rio Grande rift. Incorporated in attenuation relations such as Spudich et al. (1999) is the Joyner-Boore distance parameter, which is the nearest horizontal distance to the vertical projection of the fault rupture (see Abrahamson and Shedlock 1997, fig. 1). This distance parameter is important in estimating the locations of the three strong earthquakes. Estimates of magnitude for the three 1906 quakes were obtained by using the Spudich et al. (1999) attenuation relation to calculate the earthquake magnitude required to produce the estimated PGAs at each felt location for all three shocks. All magnitudes obtained in this way are listed in the last column of Tables 1, 2, and 3. The wide range of magnitudes in the last column of Tables 1, 2, and 3 is the result of uncertainty in the reported intensities. The very low magnitudes, for example 4.59 in Table 1, would produce an intensity at Socorro well below what was observed November 2008, Volume 30, Number 4 TABLE 3—15 November 1906: locations, observed intensities, distances from Socorro, peak ground accelerations (PGAs), and magnitudes. Locations greater than 50 km (31 mi) from Socorro are designated with a gray background. Location1 Distance3 from Socorro Modified Mecalli intensity2 Socorro VIII VII 1/4 0 0 0.276 5.72 San Antonio VII+ VI 1/2 20 (12.5) 0.172 6.96 Magdalena VI–VII VI 33 (20.5) 0.126 7.29 Sabinal VI–VII VI 48 (30) 0.126 8.02 km PGA (g)4 Magnitude5 Rossi-Forel intensity (mi) Rosedale V IV 1/2 55 (34) 0.040 6.11 Peralta V IV 1/2 85 (53) 0.040 6.96 Datil V? IV 1/2 89 (55.5) 0.040 7.05 Laguna V IV 1/2 117 (72.5) 0.040 7.60 Willard IV III 3/4 98 (61) 0.018 5.73 Carpenter IV III 3/4 127 (79) 0.018 6.25 Hillsboro IV III 3/4 140 (87) 0.018 6.44 Alamogordo IV III 3/4 155 (96.5) 0.018 6.64 Lake Valley IV III 3/4 161 (100) 0.018 6.72 Albuquerque III–IV III 1/3 115 (71.5) 0.012 5.28 Estancia III+ III 1/5 108 (67) 0.010 4.81 Cerrillos III III 167 (104) 0.0083 5.32 Santa Fe III III 200 (124.5) 0.0083 5.68 Roswell III III 230 (143) 0.0083 5.96 El Paso III III 250 (155.5) 0.0083 6.13 1 2 3 Locations and Rossi-Forel intensities from Reid (1911). Rossi-Forel conversion to Modified Mercalli intensity from Richter (1958). Distances from Socorro to other reporting localities from New Mexico Aeronautical Chart (H. M. Gousha Company) and Julyan (1996). 4 Conversion of Modified Mercalli intensity to PGA from Wald et al. (1999). 5 Magnitude required to produce the observed intensity at the listed distance from Spudich et al. (1999). TABLE 4—Rossi-Forel intensities reported at the same locations for earthquakes on 12 July, 16 July, and 15 November.1 Locations greater than 50 km (31 mi) from Socorro are designated with a gray background. Location Distance from Rossi-Forel intensity Rossi-Forel intensity Rossi-Forel intensity Socorro 12 July 16 July 15 November km (mi) Socorro 0 0 San Antonio 20 (12.5) Rosedale 55 Albuquerque 115 Lake Valley El Paso 1 VIII VIII VIII VII–VIII VII–VIII VII+ (34) IV? V V (71.5) III III–IV III–IV 161 (100) III–IV III IV 250 (155.5) III III–IV III Locations and Rossi-Forel intensities from Reid (1911). (RF VIII), and the very high magnitudes, for example 7.60 in Table 3, would produce an intensity at Socorro well above what was observed (RF VIII). The scatter in magnitude values in Tables 1, 2, and 3 cannot be used to calculate the uncertainity in the final magnitude estimates. Averages of the magnitudes listed for distances greater than 50 km (31 mi) were adopted as estimates of the local magnitude for each quake. The averages were restricted to observations at distances greater than 50 km (31 mi) because of the possibility November 2008, Volume 30, Number 4 that the true epicenters were several tens of kilometers from Socorro. Revised magnitudes from this procedure were: 12 July 1906 16 July 1906 15 November 1906 M = 5.57 M = 5.76 M = 6.18 PGA versus attenuation with distance based on Spudich et al. (1999) for these three magnitudes are plotted in Figures 2, 3, and 4. Note that the order of earthquake strengths is the same as given by Reid (1911). New Mexico Geology Earthquake locations relative to Socorro As mentioned earlier, Reid (1911) assigned RF intensity VIII at Socorro for the three strongest earthquakes in 1906–1907 Socorro earthquake swarm. The equivalent MM intensity is VII 1/4 (Richter 1958). Using Wald et al. (1999), the PGA for this intensity is 0.276 g, a value approximately 10% greater than the estimated PGA at zero Joyner-Boore distance for the magnitude 5.57 earthquake on 12 July. This indicates that the horizontal distance from Socorro to the vertical projection of the fault rupture (Joyner-Boore distance) can be assumed to be zero. The Spudich et al. (1999) attenuation relation yields a PGA of 0.255 g for a 5.57 earthquake at zero distance. Converting this value to an intensity using Wald et al. (1999) gives a MM of about VII 1/8. This is equivalent to RF VII 7/8, very close to Reid’s estimate of RF VIII for the intensity at Socorro of all three quakes. For the magnitude 5.76 earthquake on 16 July, a PGA of 0.276 g (RF of VIII) occurs at a Joyner-Boore distance of ~2 km (~1.2 mi), and for the magnitude 6.18 earthquake on 15 November, the same distance occurs at ~5.5 km (~3.4 mi). The JoynerBoore distances indicate the three earthquakes had fault ruptures at progressively greater distances from Socorro. Because the distances are small, they also suggest movement along the Socorro Canyon fault (Phillips et al. 2003; Machette and Chamberlin 1997a, b), a major north-south rift boundary fault only 4 km (2.5 mi) west of Socorro. A dip of 60° east on this normal fault has the fault plane at a depth of ~7 km (~4.4 mi) beneath Socorro (and points to the north and south), a reasonable depth for unilateral or bilateral rupture along the fault surface. Fault parameters Wells and Coppersmith (1994) developed empirical formulas relating fault rupture parameters to earthquake magnitude. Below are listed the subsurface mean rupture lengths, mean downdip rupture widths, and average displacements for normal faults producing magnitude 5.57, 5.76, and 6.18 earthquakes: Date Magnitude Length Width Average km km displacement cm 12 July 5.57 8.04 6.45 11.5 16 July 5.76 15 Nov. 6.18 10.00 7.51 15.0 16.22 10.50 27.8 Considering uncertainties in rupture parameters and Joyner-Boore distances, it is possible that the 16 July earthquake is a northerly extension of the 12 July rupture on the Socorro Canyon fault and the 15 November a southerly extension of it or vice versa. 109 FIGURE 2—12 July 1906: Peak ground acceleration [PGA (g)] versus distance from Socorro. Triangles are estimated PGAs versus distance. The solid line through the circles is PGA versus distance for a magnitude 5.57 earthquake and is based on the empirical equation of Spudich et al. (1999). FIGURE 3—16 July 1906: Peak ground acceleration [PGA (g)] versus distance from Socorro. Triangles are estimated PGAs versus distance. The solid line through the circles is PGA versus distance for a magnitude 5.76 earthquake and is based on the empirical equation of Spudich et al. (1999). Possible weaknesses in the study A good starting point in this discussion is the data on which the study is based. The paper listing Rossi-Forel intensities for the three strongest earthquakes in the 1906–07 Socorro swarm was published by Reid 110 (1911) approximately 5 yrs after the swarm. In his paper, Reid does not explain how he acquired the intensity data. Considering New Mexico’s total 1906 population of approximately 200,000 (only 16% urban), it would have been a formidable task to establish intensity values at 26 locations— New Mexico Geology many with very small populations. Reid, a professor at Johns Hopkins University, may have obtained damage and felt reports from someone in New Mexico (probably Socorro) who gathered the data shortly after the earthquakes occurred (Fig. 5). Reid would have assigned the RF intensity values. Reid’s RF intensities at distances less than 50 km (31 mi) from Socorro were not used in the study because nearly all were from locations within basins of the Rio Grande rift where surface waves would be trapped and would strongly amplify the ground motions. The following is a report by a resident in Elmendorf 36 km (22.4 mi) south of Socorro that describes the development of a strong surface wave in the Rio Grande valley (rift) during a shock that followed the 12 July event by about an hour. “We were standing out on the street at 6 o’clock when the second shock came. ‘Look at [it] coming at us’ exclaimed one of my companions. I looked up just in time to see a wave like a wave of water coming along the ground. It looked to be about ten feet high, but in reality was about ten inches. We all three watched it come and braced ourselves to meet it. We tried to stand up but it was impossible. It threw us to the ground and by the time we had struggled to our knees it was gone. We stood up [in] shock and looked at each other. It was a pretty scary experience and one I am not anxious to go through again. It is the most peculiar sensation I ever experienced.” (The report is by J. J. Sheridan, a former resident of Silver City who provided this account for the 20 July 1906 issue of the Silver City Enterprise newspaper.) The Socorro Defensor Chieftain describes this aftershock as “a second shock nearly as severe as the first” (Sanford 1963). A potential weakness in this study was the use of empirical equations from Wald et al. (1999) to convert Modified Mercalli (MM) intensity into peak ground acceleration (PGA). They used a very large number of observations that had a wide range in PGA for each value of MM intensity. Therefore use of these equations creates uncertainty in the results. A predictive equation between PGA and distance for an extensional tectonic regime (Spudich et al., 1999) was used to estimate the magnitude required to produce the estimated PGAs at each reporting location. Uncertainties in the equation’s parameters were not considered. In addition the equation was applied beyond the recommended distance range of 70 km (43.5 mi). However, application of an alternate predictive equation between PGA and distance for Western North America (Boore et al. 1997) yielded unrealistic low magnitude estimates for the three strong shocks in the 1906 swarm, for example, magnitude 5 for the 15 November 1906 earthquake. A probable reason for this result is that the relation by Boore et al. (1997) is based primarily on data from a strike-slip tectonic regime. November 2008, Volume 30, Number 4 If some uncertainties in the above procedures had been considered, it might have been possible to obtain locations that would not have been compatible with ruptures on the Socorro Canyon fault. However, it is interesting to note that Reid (1911, p. 15) concluded “the origin of the shocks was a short distance to the west, northwest or southwest of Socorro.” Summary FIGURE 4—15 November 1906: Peak ground acceleration [PGA (g)] versus distance from Socorro. Triangles are estimated PGAs versus distance. The solid line through the circles is PGA versus distance for a magnitude 6.18 earthquake and is based on the empirical equation of Spudich et al. (1999). New estimates of the magnitudes and locations of the three strongest earthquakes during the 1906–07 Socorro area swarm have been obtained. The revised magnitude estimates: 5.57 (12 July 1906), 5.76 (16 July 1906), and 6.18 (15 November 1906) differ from earlier estimates (Sanford et al. 2002) but are more robust because they are based on nearly all the available earthquake intensity data published by Reid (1911). The new analyses place all three earthquake locations very near Socorro, most likely on the east-dipping Socorro Canyon fault 4 km (2.5 mi) west of the town, a location in agreement with the general conclusion of Reid (1911). Estimates of rupture parameters for the three earthquakes indicate that only the 15 November quake could have offset the surface but probably at less than observable levels. Acknowledgments This paper was greatly improved by thoughtful and careful reviews by Richard Chamberlin (New Mexico Bureau of Geology and Mineral Resources) and Noel Barstow (IRIS-PASSCAL). I am indebted to Jane Love, Julie Hicks, Leo Gabaldon, and Lewis Gillard (New Mexico Bureau of Geology and Mineral Resources) for improving the text, figures, and tables of the original manuscript and the putting the paper into the final form presented here. References © J. E. Smith Collection. FIGURE 5—Photo by Joseph E. Smith of damage to Socorro’s masonic hall and courthouse from the 15 November 1906 earthquake. Four courthouse chimneys that had been rebuilt following the two earthquakes in July were again thrown down. Courtesy Joseph Edward Smith Photography Museum and Gallery. November 2008, Volume 30, Number 4 New Mexico Geology Abrahamson, N. A., and Shedlock, K. M., 1997, Overview: Seismological Research Letters, v. 68, pp. 9–23. Boore, D. M., Joyner, W. B., and Fumal, T. E., 1997, Equations for estimating horizontal response spectra and peak acceleration from western North American earthquakes: Seismological Research Letters, v. 68, pp. 128–153. H. M. Gousha Company, 1979–, New Mexico aeronautical chart: Published annually by H. M. Gousha Company, San Jose, scale 1:1,000,000. Julyan, R., 1996, The place names of New Mexico: University of New Mexico Press, Albuquerque, 385 pp. Machette, M. N., and Chamberlin, R. M., compilers, 1997a, Fault number 2108a, Socorro Canyon fault zone, northern section; in Quaternary fault and fold database of the United States: U.S. Geological Survey, Web site, http://earthquakes.usgs.gov/ regional/qfaults, accessed 09/26/2008 04:31 PM. Machette, M. N., and Chamberlin, R. M., compilers, 1997b, Fault number 2108b, Socorro Canyon fault zone, southern section; in Quaternary fault and fold database of the United States: U.S. Geological Survey, Web site, http://earthquakes.usgs.gov/ regional/qfaults, accessed 09/26/2008 04:33 PM. 111 Phillips, F. M., Ayarbe, J. P., Harrison, J. B., and Elmore, D., 2003, Dating rupture events on alluvial fault scarps using cosmogenic nuclides and scarp morphology: Earth and Planetary Science Letters, v. 215, pp. 203–218. Reid, H. F., 1911, Remarkable earthquakes in central New Mexico in 1906 and 1907: Bulletin of the Seismological Society of America, v. 1, pp. 10–16. Richter, C. F., 1958, Elementary seismology: W. H. Freeman, San Francisco, 768 pp. Sanford, A. R., 1963, Seismic activity near Socorro, New Mexico: New Mexico Geological Society, Guidebook, pp. 146–151. Sanford, A.R., 1998, An empirical relation between magnitude and maximum intensity for New Mexico earthquakes: New Mexico Institute of Mining and Technology, Geophysics Open-file Report 86, 4 pp. Sanford, A. R., and Lin, K., 1998, Strongest earthquakes in New Mexico: 1860 to 1998: New Mexico Institute of Mining and Technology, Geophysics Open-file Report 87, 3 pp. Sanford, A. R., Lin, K., Tsai, I., and Jaksha, L. H., 2002, Earthquake catalogs for New Mexico and bordering areas: 1869–1998: New Mexico Bureau of Geology and Mineral Resources, Circular 210, 104 pp. Sanford, A. R., Mayeau, T. M., Schlue, J. W., Aster, R. C., and Jaksha, L. H., 2006, Earthquake catalogs for New Mexico and bordering areas II: 1999–2004: New Mexico Geology, v. 28, no. 4, pp. 99–109. Spudich, P., Joyner, W. B., Lindh, A. G., Boore, D. M., Margaris, B. M., and Fletcher, J. B., 1999, SEA99: A revised ground motion predictive relation for use in extensional tectonic regimes: Bulletin of the Seismological Society of America, v. 89, pp. 1156–1170. Wald, D. J., Quitoriano, V., Heaton, T. H., and Kanamori, H., 1999, Relationships between peak ground acceleration, peak ground velocity and Modified Mercalli intensity for earthquakes in California: Earthquake Spectra, v. 15, no. 3, pp. 557–564. Wells, D. L., and Coppersmith, K. J., 1994, New empirical relationships among magnitude, rupture length, rupture width, rupture area, and surface displacement: Bulletin of the Seismological Society of America, v. 84, pp. 974–1002. Notes to page 107 1 For catalogs covering the same area for the period 1999–2004, see Sanford et al. (2006). Appendix Relationship of peak horizontal ground acceleration (PGA) to Modified Mercalli (MM) intensity (adapted from Wald et al. 1999). MM intensity Perceived shaking Damage PGA (g) I Not felt except by a very few under especially favorable None circumstances. <<0.01 II Felt only by a few persons at rest especially on upper None floors of buildings. <0.01 III Felt quite noticeably indoors; especially on upper floors None of buildings, but many people do not recognize it as an earthquake. <0.01 IV During the day felt indoors by many, outdoors by few. At night some awakened. None 0.01–0.04 V Felt by nearly everyone, many awakened. Very light—Some dishes and windows broken; cracked plaster in a few places; unstable objects overturned. 0.04–0.09 VI Felt by all, many frightened. Light—Some heavy furniture moved; a few instances of fallen plaster and damaged chimneys. 0.09–0.18 VII Very strong Moderate—Damage negligible in buildings of good design and 0.18–0.34 construction; slight to moderate in well-built ordinary structures; considerable in poorly built or badly designed structures; some chimneys broken. VIII Severe—Persons driving cars disturbed. Moderate to heavy—Damage slight in specially designed structures; 0.34–0.65 considerable in ordinary substantial buildings with partial collapse; great in poorly built structures. Chimneys toppled. IX Violent Heavy—Damage considerable in specially designed structures; well- 0.65–1.24 designed frame structures thrown out of plumb; great in substantial buildings, with partial collapse. Buildings shifted off foundations. X Extreme Very heavy—Some well-built wooden structures destroyed; most >1.24 masonry and frame structures destroyed with foundations. XI Extreme Extreme—Few, if any, (masonry) structures remain standing. >1.24 XII Extreme Extreme—Damage total. >1.24 112 New Mexico Geology November 2008, Volume 30, Number 4
