Projections for Planning Purposes Only B-1241 (L4)
advertisement
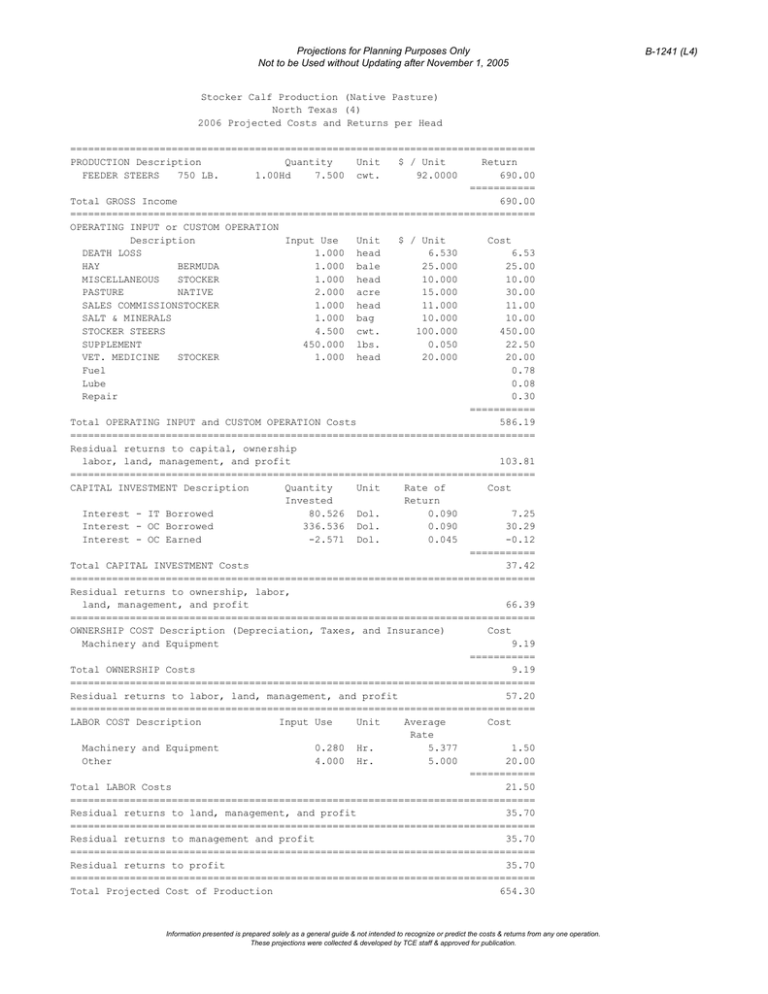
Projections for Planning Purposes Only Not to be Used without Updating after November 1, 2005 Stocker Calf Production (Native Pasture) North Texas (4) 2006 Projected Costs and Returns per Head ============================================================================== PRODUCTION Description Quantity Unit $ / Unit Return FEEDER STEERS 750 LB. 1.00Hd 7.500 cwt. 92.0000 690.00 =========== Total GROSS Income 690.00 ============================================================================== OPERATING INPUT or CUSTOM OPERATION Description Input Use Unit $ / Unit Cost DEATH LOSS 1.000 head 6.530 6.53 HAY BERMUDA 1.000 bale 25.000 25.00 MISCELLANEOUS STOCKER 1.000 head 10.000 10.00 PASTURE NATIVE 2.000 acre 15.000 30.00 SALES COMMISSIONSTOCKER 1.000 head 11.000 11.00 SALT & MINERALS 1.000 bag 10.000 10.00 STOCKER STEERS 4.500 cwt. 100.000 450.00 SUPPLEMENT 450.000 lbs. 0.050 22.50 VET. MEDICINE STOCKER 1.000 head 20.000 20.00 Fuel 0.78 Lube 0.08 Repair 0.30 =========== Total OPERATING INPUT and CUSTOM OPERATION Costs 586.19 ============================================================================== Residual returns to capital, ownership labor, land, management, and profit 103.81 ============================================================================== CAPITAL INVESTMENT Description Quantity Unit Rate of Cost Invested Return Interest - IT Borrowed 80.526 Dol. 0.090 7.25 Interest - OC Borrowed 336.536 Dol. 0.090 30.29 Interest - OC Earned -2.571 Dol. 0.045 -0.12 =========== Total CAPITAL INVESTMENT Costs 37.42 ============================================================================== Residual returns to ownership, labor, land, management, and profit 66.39 ============================================================================== OWNERSHIP COST Description (Depreciation, Taxes, and Insurance) Cost Machinery and Equipment 9.19 =========== Total OWNERSHIP Costs 9.19 ============================================================================== Residual returns to labor, land, management, and profit 57.20 ============================================================================== LABOR COST Description Input Use Unit Average Cost Rate Machinery and Equipment 0.280 Hr. 5.377 1.50 Other 4.000 Hr. 5.000 20.00 =========== Total LABOR Costs 21.50 ============================================================================== Residual returns to land, management, and profit 35.70 ============================================================================== Residual returns to management and profit 35.70 ============================================================================== Residual returns to profit 35.70 ============================================================================== Total Projected Cost of Production 654.30 Information presented is prepared solely as a general guide & not intended to recognize or predict the costs & returns from any one operation. These projections were collected & developed by TCE staff & approved for publication. B-1241 (L4) Projections for Planning Purposes Only Not to be Used without Updating after November 1, 2005 B-1241 (L4) Stocker Calf Production (Native Pasture) North Texas (4) 2006 Projected Costs and Returns per Head GROSS INCOME Description ============================ FEEDER STEERS 750 LB. Quantity ========= 1.00Hd 7.500 Unit ==== cwt. $ / Unit =========== 92.0000 Total GROSS Income VARIABLE COST Description ================================= DEATH LOSS HAY BERMUDA Interest - Earned Interest - OC Borrowed LIVESTOCK LABOR MISCELLANEOUS STOCKER PASTURE NATIVE PENS & EQUIPMENT PICKUP TRUCK 3/4 TON SALES COMMISSIONSTOCKER SALT & MINERALS STOCKER STEERS SUPPLEMENT VET. MEDICINE STOCKER Total =========== 6.53 25.00 -0.12 30.29 20.00 10.00 30.00 0.46 2.20 11.00 10.00 450.00 22.50 20.00 =========== 637.86 Total VARIABLE COST Break-Even Price, Total Variable Cost $ 85.04 per cwt. of FEEDER STEERS GROSS INCOME minus VARIABLE COST FIXED COST Description ================================= Machinery and Equipment 52.14 Unit ==== Acre Total FIXED Cost Break-Even Price, Total Cost $ Total of ALL Cost NET PROJECTED RETURNS Total =========== 690.00 =========== 690.00 Total =========== 16.44 =========== 16.44 87.24 per cwt. of FEEDER STEERS 654.30 35.70 Information presented is prepared solely as a general guide & not intended to recognize or predict the costs & returns from any one operation. These projections were collected & developed by TCE staff & approved for publication.
