Kriging for Drop Test Data
advertisement
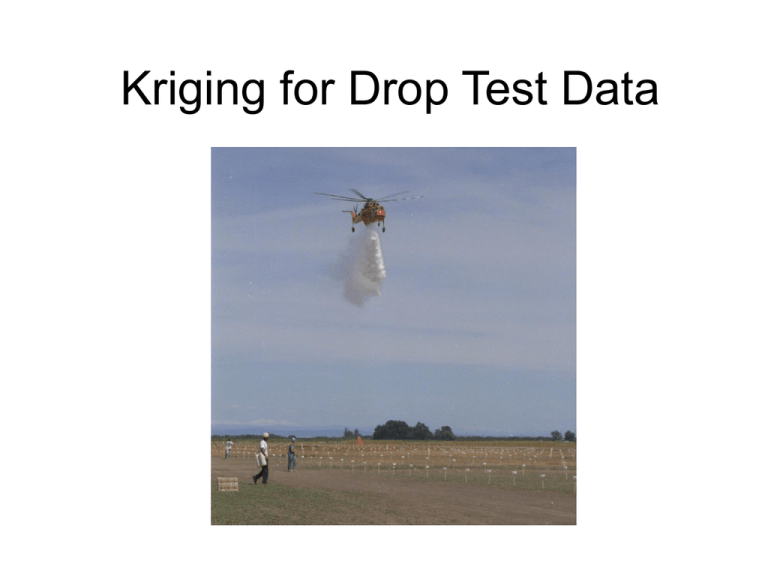
Kriging for Drop Test Data What is the coverage of these retardant drops? We use the drop test to measure coverage. Retardant is collected in cups. Cups are capped and weighed. Knowing the weights allows us to recreate the pattern as a contour plot. Each cup becomes a gpc value, grams per hundred square feet. Converting grams of retardant into gpc. 1 gallon 1 grid cup 0.13454172 3785.4118 cc 0.001963495 hundred square feet weight of retardant (grams) 0.13454172 density of retardant (grams/cc) gpc Both plots below use the same raw data. In the first plot, the contours are created from an array of raw data at a 15 by 15 spacing and by interpolation routines inherent in Splus software. In the second plot the points between raw data are estimated using kriging to produce an array of higher resolution (7.5 by 7.5) and then by Splus software. 15 by 15 array 7.5 by 7.5 array Which one is more accurate? We use a weighted average of the raw gpc values to predict unknown values. We use a method called kriging to come up with weights for the weighted average. These kriging weights are based on distance, direction and variability of the raw data. Steps to find the weighted average: 1. Create a variogram which is a mathematical description of the variation between observed gpc values. 2. Use the variogram to estimate the covariance at different distances. 3. Use the covariances to calculate kriging weights. 4. Calculate the weighted average of the raw data. Step 1: Create a variogram which is a mathematical description of the variation between observed gpc values. The variogram is the average squared difference between pairs of gpc values. The table on the next slide shows the variogram values for drop 104. In the first line of the table we see that at a distance of 23.97096 feet there are 4,120 pairs of cups. The average squared difference between all these pairs is 0.145876. distance gamma (variogram) number of pairs 23.97096 0.145876 4120 58.1154 0.294227 18028 86.77792 0.334119 11831 111.9615 0.481884 30293 145.6326 0.553698 29346 170.1047 0.613125 34471 201.5029 0.679907 42091 227.975 0.694383 41259 257.2455 0.781188 50939 283.3795 0.771159 42779 310.9756 0.875735 61842 342.395 0.889409 60465 369.5541 0.928662 61478 400.3173 0.975992 67232 427.0981 0.987465 60637 456.3625 1.044142 72292 484.288 1.049219 63810 512.6638 0.948816 75918 542.5489 0.911984 68710 569.6804 0.808484 73019 Note: The distances in this table are calculated from the length of the drop pattern and the grid spacing. 0.334119 111.9615 0.481884 145.6326 0.553698 170.1047 0.613125 201.5029 0.679907 227.975 0.694383 257.2455 0.781188 283.3795 0.771159 310.9756 0.875735 342.395 0.889409 369.5541 0.928662 400.3173 0.975992 427.0981 0.987465 456.3625 1.044142 484.288 1.049219 512.6638 0.948816 542.5489 0.911984 569.6804 0.808484 1.0 86.77792 0.8 0.294227 0.6 58.1154 0.4 0.145876 Function: Spherical range: 430.1663057 0.8386289 sill: 0.1224344 nugget: 0.2 23.97096 We plot the data from the table and fit a curve. 0.0 gamma (variogram) gamma distance objective = 0.0531 0 100 200 300 distance 400 500 Sill: The value of the average squared difference at the range. • Nugget: The vertical jump between zero and the first variogram value. 0.8 0.6 0.4 0.2 • Function: Spherical range: 430.1663057 sill: 0.8386289 nugget: 0.1224344 0.0 Range: As the distance between pairs increases, the average squared difference between pairs will increase. Eventually, an increase in distance will no longer produce and increase in average squared difference, and the variogram will reach a plateau. The distance at which the plateau is reached is the range. gamma • 1.0 Three features of the trend line are used to calculate weights in our weighted average. objective = 0.0531 0 100 200 300 400 500 distance Now that we have our range, sill and nugget we will look at some sample data to calculate the weights. Example of gpc values in their position on the grid with unknown values we want to predict. 240.0 0.20 0.14 0.20 0.39 0.20 0.13 0.30 0.09 0.20 0.51 0.19 0.13 0.04 0.44 0.90 0.94 0.46 1.95 0.84 0.34 0.33 0.25 0.91 0.82 0.57 0.49 1.30 3.37 2.43 4.23 3.19 2.76 3.03 2.34 1.90 1.76 3.14 3.94 1.72 1.76 0.91 3.43 5.99 2.23 2.43 2.28 3.48 3.80 3.98 2.24 5.87 5.84 1.57 1.23 2.71 2.22 1.03 0.94 0.94 1.49 1.23 0.98 1.01 2.94 0.99 0.20 0.67 0.68 0.47 0.29 0.47 1.29 1.24 0.68 0.56 1.41 1.94 0.48 0.01 0.01 0.06 0.23 0.23 0.32 0.60 0.75 0.16 0.20 0.71 0.80 0.35 232.5 225.0 217.5 210.0 202.5 195.0 187.5 180.0 172.5 165.0 157.5 150.0 540.0 555.0 570.0 585.0 600.0 615.0 630.0 645.0 660.0 675.0 690.0 705.0 720.0 547.5 562.5 577.5 592.5 607.5 622.5 637.5 652.5 667.5 682.5 697.5 712.5 For the purpose of this explanation we will only focus on 12 observed gpc values to predict one unknown value. The picture to the right shows the area we will focus on inside the box. 240.0 0.20 0.14 0.20 0.39 0.20 0.13 0.30 0.09 0.20 0.51 0.19 0.13 0.04 0.44 0.90 0.94 0.46 1.95 0.84 0.34 0.33 0.25 0.91 0.82 0.57 0.49 1.30 3.37 2.43 4.23 3.19 2.76 3.03 2.34 1.90 1.76 3.14 3.94 1.72 1.76 0.91 3.43 5.99 2.23 2.43 2.28 3.48 3.80 3.98 2.24 5.87 5.84 1.57 1.23 2.71 2.22 1.03 0.94 0.94 1.49 1.23 0.98 1.01 2.94 0.99 0.20 0.67 0.68 0.47 0.29 0.47 1.29 1.24 0.68 0.56 1.41 1.94 0.48 0.01 0.01 0.06 0.23 0.23 0.32 0.60 0.75 0.16 0.20 0.71 0.80 0.35 232.5 225.0 217.5 210.0 202.5 195.0 187.5 180.0 172.5 165.0 157.5 150.0 540.0 555.0 570.0 585.0 600.0 615.0 630.0 645.0 660.0 675.0 690.0 705.0 720.0 547.5 562.5 577.5 592.5 607.5 622.5 637.5 652.5 667.5 682.5 697.5 712.5 195 2.43 2.28 3.48 3.80 180 0.94 0.94 1.49 1.23 165 0.47 1.29 1.24 0.68 615 630 645 660 Step 2: Use the variogram to estimate the covariance at different distances. Below is a table showing the position of the known values, the corresponding gpc values and the distance to the unknown values. X Y Z Distance from unknown value in feet 1 615 165 0.468742 23.72 2 615 180 0.937485 10.61 3 615 195 2.432393 10.61 4 630 165 1.292209 23.72 5 630 180 0.937485 10.61 6 630 195 2.280368 10.61 7 645 165 1.241534 31.82 8 645 180 1.494908 23.72 9 645 195 3.483896 23.72 10 660 165 0.68411 43.73 11 660 180 1.228865 38.24 12 660 195 3.800614 38.24 Next, determine all the distances between known and unknown values, shown in this table. 0 unknown value 1 2 3 4 5 6 7 8 9 10 11 12 0 0.00 23.72 10.61 10.61 23.72 10.61 10.61 31.82 23.72 23.72 43.47 38.24 38.24 1 23.72 0.00 15.00 30.00 15.00 21.21 33.54 3.00 33.54 46.23 45.00 46.23 54.08 2 10.61 15.00 0.00 15.00 21.21 15.00 21.21 33.54 30.00 33.54 47.43 45.00 47.43 3 10.61 30.00 15.00 0.00 33.54 21.21 15.00 42.43 33.54 30.00 54.08 47.43 45.00 4 23.72 15.00 21.21 33.54 0.00 15.00 30.00 15.00 21.21 33.54 30.00 33.54 42.43 5 10.61 21.21 15.00 21.21 15.00 0.00 15.00 21.21 15.00 21.21 33.54 30.00 33.54 6 10.61 33.54 21.21 15.00 30.00 15.00 0.00 33.54 21.21 15.00 42.43 33.54 30.00 7 31.82 30.00 33.54 42.43 15.00 21.21 33.54 0.00 15.00 30.00 15.00 21.21 33.54 8 23.72 33.54 30.00 33.54 21.21 15.00 21.21 15.00 0.00 15.00 33.54 21.21 15.00 9 23.72 42.43 33.54 30.00 33.54 21.21 15.00 30.00 15.00 0.00 33.54 21.21 15.00 10 43.47 45.00 47.43 54.08 30.00 33.54 42.43 15.00 33.54 33.54 0.00 15.00 30.00 11 38.24 47.43 45.00 47.43 33.54 30.00 33.54 21.21 21.21 21.21 15.00 0.00 15.00 12 38.24 54.08 47.43 45.00 42.43 33.54 30.00 33.54 15.00 15.00 30.00 15.00 0.00 sill 3 h Cov( h) range ( sill nugget )e if h 0 if h 0 Cov(h) means the covariance at distance h We will use a range = 430.1663057, nugget = 0.1224344, sill = 0.8386289 from the variogram we created earlier. We calculate all the covariances at those distances from the table in the previous slide. Looking at the first column from the previous table we get: C(00.00) = sill = 0.8386289 3 ( 23.72) 430.1663057 C(23.72) = 0.7161945e C(10.61) = 0.7161945e .006974(10.61) 0.665113126 C(10.61) = 0.665113126 C(23.72) = 0.606991467 C(10.61) = 0.665113126 C(10.61) = 0.665113126 C(31.82) = 0.573660412 C(23.72) = 0.606991467 C(23.72) = 0.606991467 C(43.47) = 0.528895018 C(38.24) = 0.548542205 C(38.24) = 0.548542205 0.606991467 Our new table of covariances… 0 1 2 3 4 5 6 7 8 9 10 11 12 0 0.8386 0.6070 0.6651 0.6651 0.6070 0.6651 0.6651 0.5737 0.6070 0.6070 0.5289 0.5485 0.5485 1 0.6070 0.8386 0.6451 0.5810 0.6451 0.6177 0.5668 0.7014 0.5668 0.5188 0.5233 0.5188 0.4912 2 0.6651 0.6451 0.8386 0.6451 0.6177 0.6451 0.6177 0.5668 0.5810 0.5668 0.5145 0.5233 0.5145 3 0.6651 0.5810 0.6451 0.8386 0.5668 0.6177 0.6451 0.5327 0.5668 0.5810 0.4912 0.5145 0.5233 4 0.6070 0.6451 0.6177 0.5668 0.8386 0.6451 0.5810 0.6451 0.6177 0.5668 0.5810 0.5668 0.5327 5 0.6651 0.6177 0.6451 0.6177 0.6451 0.8386 0.6451 0.6177 0.6451 0.6177 0.5668 0.5810 0.5668 6 0.6651 0.5668 0.6177 0.6451 0.5810 0.6451 0.8386 0.5668 0.6177 0.6451 0.5327 0.5668 0.5810 7 0.5737 0.5810 0.5668 0.5327 0.6451 0.6177 0.5668 0.8386 0.6451 0.5810 0.6451 0.6177 0.5668 8 0.6070 0.5668 0.5810 0.5668 0.6177 0.6451 0.6177 0.6451 0.8386 0.6451 0.5668 0.6177 0.6451 9 0.6070 0.5327 0.5668 0.5810 0.5668 0.6177 0.6451 0.5810 0.6451 0.8386 0.5668 0.6177 0.6451 10 0.5289 0.5233 0.5145 0.4912 0.5810 0.5668 0.5327 0.6451 0.5668 0.5668 0.8386 0.6451 0.5810 11 0.5485 0.5145 0.5233 0.5145 0.5668 0.5810 0.5668 0.6177 0.6177 0.6177 0.6451 0.8386 0.6451 12 0.5485 0.4912 0.5145 0.5233 0.5327 0.5668 0.5810 0.5668 0.6451 0.6451 0.5810 0.6451 0.8386 Step 3. Use the covariances to calculate kriging weights. 0.6070 First well separate the covariance associated with the unknown value. This is in the first column or first row. 0.6651 0.6651 0.6070 We’ll call this matrix D = 0.6651 0.6651 0.5737 0.6070 0.6070 0.5289 0.5485 0.5485 1 The remaining matrix we’ll call C = 0.6070 0.6651 0.6651 0.6070 0.6651 0.6651 0.5737 0.6070 0.6070 0.5289 0.5485 0.5485 0.8386 0.6451 0.5810 0.6451 0.6177 0.5668 0.7014 0.5668 0.5188 0.5233 0.5188 0.4912 1 0.6451 0.8386 0.6451 0.6177 0.6451 0.6177 0.5668 0.5810 0.5668 0.5145 0.5233 0.5145 1 0.5810 0.6451 0.8386 0.5668 0.6177 0.6451 0.5327 0.5668 0.5810 0.4912 0.5145 0.5233 1 0.6451 0.6177 0.5668 0.8386 0.6451 0.5810 0.6451 0.6177 0.5668 0.5810 0.5668 0.5327 1 0.6177 0.6451 0.6177 0.6451 0.8386 0.6451 0.6177 0.6451 0.6177 0.5668 0.5810 0.5668 1 0.5668 0.6177 0.6451 0.5810 0.6451 0.8386 0.5668 0.6177 0.6451 0.5327 0.5668 0.5810 1 0.5810 0.5668 0.5327 0.6451 0.6177 0.5668 0.8386 0.6451 0.5810 0.6451 0.6177 0.5668 1 0.5668 0.5810 0.5668 0.6177 0.6451 0.6177 0.6451 0.8386 0.6451 0.5668 0.6177 0.6451 1 0.5327 0.5668 0.5810 0.5668 0.6177 0.6451 0.5810 0.6451 0.8386 0.5668 0.6177 0.6451 1 0.5233 0.5145 0.4912 0.5810 0.5668 0.5327 0.6451 0.5668 0.5668 0.8386 0.6451 0.5810 1 0.5145 0.5233 0.5145 0.5668 0.5810 0.5668 0.6177 0.6177 0.6177 0.6451 0.8386 0.6451 1 0.4912 0.5145 0.5233 0.5327 0.5668 0.5810 0.5668 0.6451 0.6451 0.5810 0.6451 0.8386 1 1 1 1 1 1 1 1 1 1 1 1 1 0 The equation to determine kriging weights is: C * kriging weights matrix = D where we want the kriging weights matrix. The easiest way to solve this equation is by using linear algebra. We can multiply both sides by C inverse… = C-1 * C * weights = D * C-1 = I * weights = D * C-1 = weights = D * C-1 C-1 = 4.083 -1.216 -0.461 -0.722 -0.294 -0.137 -2.655 0.458 0.325 0.523 0.161 -0.064 0.139 -1.304 4.506 -1.239 -0.657 -0.842 -0.478 0.660 -0.267 -0.176 -0.232 -0.031 0.061 0.091 -0.441 -1.255 3.914 -0.132 -0.461 -1.228 0.286 -0.075 -0.394 -0.045 -0.015 -0.154 0.165 -1.280 -0.507 -0.066 4.425 -0.806 -0.045 -0.297 -0.695 -0.087 -0.658 -0.160 0.175 0.061 -0.452 -0.802 -0.441 -0.819 4.971 -0.781 -0.066 -0.862 -0.425 -0.258 -0.170 0.105 -0.023 -0.076 -0.500 -1.234 -0.074 -0.790 4.557 0.053 -0.375 -1.097 -0.039 -0.126 -0.299 0.054 -0.359 -0.082 0.039 -1.066 -0.334 0.016 4.924 -1.246 -0.044 -1.465 -0.552 0.170 0.053 -0.099 -0.091 -0.014 -0.534 -0.804 -0.363 -1.142 5.029 -0.748 0.411 -0.366 -1.279 0.010 0.048 -0.087 -0.364 0.006 -0.393 -1.093 -0.047 -0.735 4.548 -0.200 -0.570 -1.115 0.051 -0.186 -0.010 0.032 -0.461 -0.186 -0.023 -1.298 0.402 -0.221 3.875 -1.359 -0.565 0.162 0.007 0.019 0.001 -0.111 -0.153 -0.123 -0.543 -0.361 -0.571 -1.351 4.415 -1.229 0.080 0.058 0.023 -0.167 0.145 0.093 -0.302 0.126 -1.274 -1.110 -0.560 -1.227 4.195 0.158 0.169 0.085 0.160 0.074 -0.020 0.051 -0.045 0.032 0.063 0.190 0.087 0.153 -0.599 Kriging weights = 0.0580 0.1989 0.2249 0.0384 0.1745 0.1984 0.0043 0.0378 0.0542 0.0045 0.0029 0.0034 Step 4. Calculate the weighted average of the raw data to find the weighted average. X Y Z Distance from unknown value (feet) Weights Product 1 615 165 0.468742 23.72 0.058 0.027164915 2 615 180 0.937485 10.61 0.199 0.186443159 3 615 195 2.432393 10.61 0.225 0.546960529 4 630 165 1.292209 23.72 0.038 0.049666153 5 630 180 0.937485 10.61 0.175 0.163602356 6 630 195 2.280368 10.61 0.198 0.452333773 7 645 165 1.241534 31.82 0.004 0.005331766 8 645 180 1.494908 23.72 0.038 0.056440308 9 645 195 3.483896 23.72 0.054 0.188875433 10 660 165 0.68411 53.05 0.004 0.003056074 11 660 180 1.228865 38.24 0.003 0.003582303 12 660 195 3.800614 38.24 0.003 0.012744684 1.696201453 Notice the greater the distance the smaller the weight. 1.696 gpc 0.32 1.95 3.19 2.23 1.03 0.29 0.39 0.46 4.23 5.99 2.22 0.47 0.23 0.94 2.43 3.43 2.71 0.68 0.06 0.14 0.90 3.37 1.23 0.67 0.44 1.30 1.57 0.01 0.60 0.84 2.76 0.75 0.30 0.34 3.03 0.16 0.09 0.33 2.34 0.04 0.49 1.72 5.84 0.99 0.48 0.35 0.13 0.57 3.94 5.87 2.94 1.94 0.80 0.19 0.82 3.14 2.24 1.01 1.41 0.71 0.51 0.91 1.76 3.98 0.98 0.56 0.20 0.25 1.90 195 2.43 2.28 3.48 3.80 180 0.94 0.94 1.49 1.23 165 0.47 1.29 1.24 0.68 615 630 645 660 Re-cap: •Model the variation across the raw data. •Use the features of the model to calculate kriging weights. •Calculate the weighted average of the raw data.
