141E (Oncorhynchus
advertisement
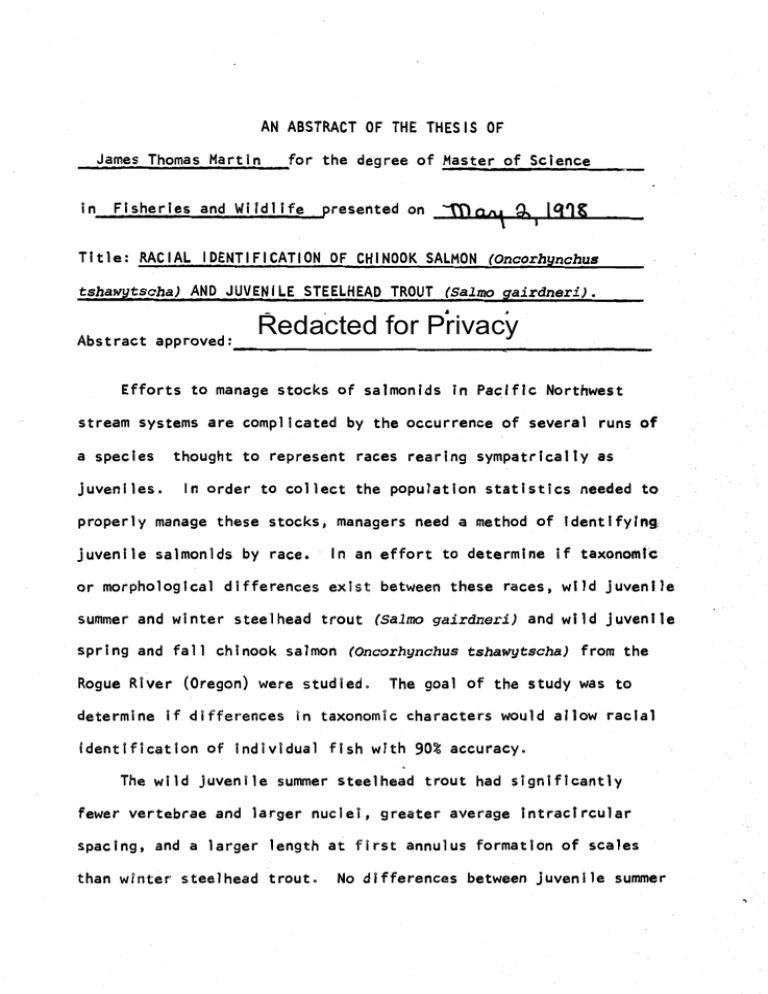
AN ABSTRACT OF THE THESIS OF James Thomas Martin in for the degree of Master of Science Fisheries and Wildlife presented on ITIcIAA g, Title: RACIAL IDENTIFICATION OF CHINOOK SALMON 141E (Oncorhynchus tshawtscha)ANDavENILEsTEELE_F.RouT(sainzoaiz'dneri)Abstract approved: Redacted for Privacy Efforts to manage stocks of salmonids in Pacific Northwest stream systems are complicated by the occurrence of several runs of a species juveniles. thought to represent races rearing sympatrically as In order to collect the population statistics needed to properly manage these stocks, managers need a method of identifying juvenile salmonids by race. In an effort to determine if taxonomic or morphological differences exist between these races, wild juvenile summer and winter steelhead trout (Salm gairdneri) and wild juvenile spring and fall chinook salmon (Oncorhynchus tshawytscha) from the Rogue River (Oregon) were studied. The goal of the study was to determine if differences in taxonomic characters would allow racial identification of individual fish with 90% accuracy. The wild juvenile summer steelhead trout had significantly fewer vertebrae and larger nuclei, greater average intracircular spacing, and a larger length at first annulus formation of scales than winter steeihead trout. No differences between juvenile summer and winter steelhead trout were found In otolith nuclear diameter, total lipids or fatty acid composition of the muscle tissue. Wild juvenile spring chinook salmon exhibited significantly lower vertebral counts, larger otolith nuclear diameter, greater average intracircular spacing, larger scale nuclei, and a larger first and second band of five intracircular spaces than juvenile fall chinook salmon. Mesentary fat deposition was highly variable between fish from the same streams and was not useful in separating juveniles by race. Although significant differences between races were found for both species, none of these differences were sufficient to allow the racial identification of individual fish with 90% accuracy. It is not known if the differences found were caused by genetic or environmental effects or both. One experiment showed that summer and winter steelhead showed no difference in vertebrae or otolith dimensions when incubated under the same conditions, suggesting that differences found in wild steelhead trout were caused by environmental effects. The lack of distinct phenotypic differences between individual fish of different races may be caused by extensive interbreeding between races of salmonids in the Rogue Basin due to large environmental variability during the spawning season for chinook salmon and steelhead trout. It is also possible that environmental variation in the early life history masked genetic differences between the races. Racial Identification of Chinook Salmon (Oncorhynchus tshawytscha) and Juvenile Steelhead Trout (Salm° gairdneri) by James Thomas Martin A THESIS submitted to Oregon State University in partial fulfillment of the requirements for the degree of Master of Science June, 1978 APPROVED: Redacted for Privacy or .... Profetli in charge of major Redacted for Privacy Head o Department Fisheries and Wildlife Redacted for Privacy Dean of Graduate Shoot Date thesis is presented Typed by Jan Ehmke for ffla,1 icr)E James Thomas Martin Acknowledgments I would like to thank my major professor, Dr. Carl B. Schreck for his guidance and patience. Thanks are also due Mario Solazzi, Tumi Tomasson, Dr. Jack McIntyre and all my friends on the Rogue Basin Evaluation Program crew, who helped with the gathering of samples. Thanks to Jan Ehmke for typing this manuscript. Thanks to Jim Lichatowich, Dr. Norbert Hartmann, Steve Cramer, and Dr. Lavern Weber for their helpful review. Thanks to Bob Lowry for all his help with the gas chromatography. And most of all, thanks to the number one vertebrae counter in the world, my wife Carolyn. TABLE OF CONTENTS 1NTRODUC1ION.............. 000000000006000 00000G MATERIALS AND METHODS,..., "agog 1 00.0000.0.0 ..... 0.0 4 Vertebral Number 4 Mesentery Fat Deposition 7 Scale Characteristics 7 Otolith Nuclear Diameter 8 Total Lipids 8 10 Fatty Acid Composition 12 RESULTS 12 Steelhead Trout Vertebral Number 12 Scale Characteristics 12 t110/larI22l2=111.1.211 17 Otolith Nuclear Diameter 17 TotalLipids...0000009 "0000 18 Fatty Acid Composition 21 Chinook Salmon Vertebral Number 21 Scale Characteristics 21 Mesentary ,Fat Deposition 21 Otolith Nuclear Diameter...... ....... .......... 26 DISCUSSION BIBLIOGRAPHY , 31 LIST OF FIGURES Page Figure, 1 Sampling locations in the Rogue River basin 2 Steelhead trout otolith showing the metamorphic check enclosing the nuclear area (arrow) 3 5 9 Gas chromatogram of fatty acids from steelhead trout 11 LIST OF TABLES 1'221 Table 1 A summary of field collections sampled from the Rogue Basin00000000000000000. ...... 0000000.00 2 Selected taxonomic characteristics for juvenile summer and winter steelhead trout from the Rogue River 3 8 13 Regressions of scale radius (mm x 88) on fork length for juvenile summer and winter steelhead trout from the Rogue River............... 4 14 Regressions of circull number on scale radius (mm x 88) of juvenile summer and winter steelhead trout from the Rogue River 5 15 Length of Juvenile summer and winter steelhead trout, back-calculated using the Lee-Fraser direct proportion method and a scale radius vs. fork length regression method (see text) 6 Total muscle ripids from summer and winter steelhead trout from the Rogue River......................... 7 16 15 Relative amounts of 15 fatty acids in juvenile summer and winter steelhead trout from the RogueRiver..... ....... 8 0000000O0000000.00"090 ......... 000 20 Selected taxonomic characteristics of juvenile spring and fall chinook salmon from the Rogue River...........,..................... ..... 0000000oWeee 22 Table 9 Regressions of scale radius on fork length for juvenile spring and fall chinook salmon from the Rogue River ....... 000 ..... 000000000000000000 0 ...... 00 10 23 Regressions of scale radius on circuli number for juvenile spring and fall chinook from the Rogue RiVer0000000000000000000000000000000000000000000 000000 26 RACIAL IDENTIFICATION OF CHINOOK SALMON (Oncorhynchps tshawytscha) AND JUVENILE STEELHEAD TROUT (Salmo gairdneri) INTRODUCTION Fishery management has been complicated by the occurrence of distinct populations or races which may be genetically segregated but exist sympatrically in streams. The manager needs to identify the various races or distinct populations within a basin, but this can be confounded by the lack of phenotypic differences particu- larly in juveniles. Stocks of chinook salmon and steelhead trout in the Rogue River in southern Oregon are separated into two major runs each. These runs are considered to be races isolated by spawning timing and area (Rivers 1963; Everest 1973; Lichatowich 1976). Management of these stocks has concentrated on adults because races can be separated by differences in size at return, migration timing, seasonal distribution, timing of spawning, spawning habitat, and scale characteristics (Rivers 1963; Everest 1973; Lichatowich 1976). Knowledge of how juveniles of these races partition the freshwater environment in time and space has been incomplete because of the inability to identify juvenile salmonids by race in field collections. To understand how environmental alteration and changing management approaches will affect populations of salmonids in streams, managers need to determine changes in distribution, growth, survival, migration size and time, and parr-smolt transformation of juvenile salmonids. Changes in these characteristics have been shown to be 2 related to adult return of salmonids. Since effects may not be the same for juveniles of all races of a species, managers would gather separate population statistics if the juveniles of each race could be identified in field collections. The general purpose of this study was to determine characteristics by which juvenile chinook salmon and steelhead trout could be racially identified in field collections from the Rogue River. The usefulness of differences between races in taxonomic characters to the fishery manager depends on two factors: 1) the magnitude of the differences, which determine how accurately individual fish can be identified by race, and 2) the genetic basis for these differences, which affect their stability in time and space. A reasonable goal for separation of juveniles by race for the collection of population statistics is separation of individual fish with 90% accuracy. To achieve this goal, a characteristic would have to differ between races such that the 90% confidence interval -I- "t" for individual observations (mean standard deviations) do not overlap Although samples were selected from as widely divergent habitats as possible to maximize the environmental variability, it should be clear that this experiment was not designed to account for the genetic or environmental effects which may have caused these differences in characteristics. The specific goal of the study was to examine field collections of steelhead trout and chinook salmon from the Rogue Basin for differences in characteristics which would allow separation of individual fish by race with 90% accuracy. Characteristics to be screened were selected from a review of the literature. I evaluated the differences between juvenile summer and winter steelhead trout and juvenile spring and fall chinook salmon in vertebrae number and mesentery fat (Smith 1969), otolith dimensions (McKern, Horton and Koski 1974; Rybock, Horton and Fessler 1975) and scale characteristics (Clutter and Whitesel 1956). I also evaluated total lipids and fatty acid composition (Saddler et al., 1965) for differences between races of steelhead trout. 4 MATERIALS AND METHODS Juvenile salmonids of known race were collected from areas of the Rogue Basin where races of steelhead trout and chinook salmon are segregated in spawning habitat. I assumed that fish collected in areas where a single race spawns are progeny of that race. The racial segregation of spawning areas was determined by studies of adult salmonids in the Rogue Basin (Everest 1979; Lichatowich 1976). Fish were trapped, seined or electrofished from streams throughout the Rogue Basin (Figure 1). The wild juvenile spring and fall chinook salmon were collected and frozen in May through July 1977. The wild juvenile summer and winter steelhead were collected March through July 1977. Special samples of wild juvenile summer and winter steelhead trout were collected for the total lipids and fatty acid analysis in February 1978 (Table 1). Samples of eggs from summer and winter steelhead were incubated and reared under identical conditions at Cole Rivers Hatchery, Oregon to test the importance of genetics in determining potential differences in vertebral number and otolith characteristics. Adult summer and winter steelhead were identified by scale characteristics and time of entry into the hatchery. Vertebral Number Vertebrae, Including the last three upturned centre, were counted on X-Ray photographs taken of the specimens. A random sample of 25% of the fish were counted again to check the accuracy of the first count. SAND HOLE LOBSTER CR. SARDINE CR. INDIAN CR QUO SATANA CR. LOWER ILLINOIS RIVER TABLE ROCK HIGH BANKS GRANTS PASS GALLS -CR. EDFORD FOOTS CR. PPLEGATE RIVER UPPER ILLINOIS RIVER Figure 1. OLE RIVERS HATCHERY Sampling locations in the Rogue River basin. 6 Table 1. A summary of field collections sampled from the Rogue Basin. Method Collection Site Stock Date Summer Steelhead 3/77 Galls Creek Electrofished 2/78 Galls Creek Electrofished 3/77 Sardine Creek Electrofished 3/77 Foots Creek Electrofished 2/78 Foots Creek Electrofished 4/78 Cole Rivers Hatchery Seined 7/77 Lower Illinois R. Seined 6/77 Lobster S Quosatana C 3/77 Upper Illinois R. Electrofished 2/78 Indian Creek Electrofished 4/78 Cole Rivers Hatchery Seined 5/77 Sand Hole Seined 5/77 Table Rock Trapped 5/77 High Banks Seined 5/77 Applegate R. Seined 6/77 Lobster Creek Trapped 7/77 Quosatana Creek Seined Winter Steelhead Spring Chinook Fall Chinook . Seined Mesentary Fat Deposition Mesentery fat was dissected from the stomach and gut as described by Smith (1969) and then weighed. Scale Characteristics The largest unregenerated scales from each fish were mounted on a glass slide in a solution of 5% glycerine and 95% waterglass A cover slip was placed over the scales. (sodium silicate). All scales were read on a Bausch and Lomb scale projector which magnified the image 88 times. Measurements were taken in the anterior field at a 200 angle from the midline bissecting the length of the scale. Each scale was measured for nuclear radius, total scale radius, total circuit number, average intracircular spacing, and width of the first and second band of five circull. The samples of steelhead trout included some older age classes of juveniles. Measurements of radius, circull number and average spacing between annuli were made on scales from these fish. All scale characteristics were read on two scales from each fish and a mean was calculated. The length at annulus formation was calculated for all 1+ or older steelhead using the Lee-Fraser method Ln = Sn/S (L-C) (Tesch 1971) given by +C Where: Ln = fork length (cm) of fish at time n, L = fork length (cm) of fish when captured, Sn = scale radius at time n, S = total scale radius (mm) when captured, and C = length (cm) of fish when scale radius is equal to zero. The value of C is calculated from a least squares regression of scale radius on fork length. 8 Another technique used to back-calculate length at first annulus was to insert the measurement of scale radius to the first annulus into the scale radius vs. fork length regression generated for all the samples of a particular race.' Regressions of scale radius on length and circull number on scale radius were compared between races using the full and reduced model comparisons described by Neder and Wasserman (1974). Otolith Nuclear Radius The otoliths collected from the juvenile salmonids were cleared and stored for approximately one week in a solution of 50% glycerine and 50% water prior to the first reading. Otoliths were read in a black porcelain watch glass under a microscope with a micrometer in the eyepiece. Light was reflected downward onto the otollth at 450 angle (Kim and Koo 1963). The metamorphic check of the nucleus was identified as a narrow black band near the center of the otolith, well within the first year's summer growth band (Figure 2). If two or more bands were present, the darkest was measured, and if both bands were equally dark, the narrowest band was measured. Both otoliths were read and a mean value was calculated for each fish. samples were not clear enough to read. Approximately 25% of the If the difference between readings of two otoliths from the same fish was greater than 25% of the mean value, the sample was considered not clear. Total Lipids Lipids were extracted with chloroform-methanol (2:1) as described 9 Figure 2. Steelhead trout otolith showing the metamorphic check enclosing the nuclear area (arrow). 10 by B/igh and Dyer (1959) from a 2 g sample of epaxial muscle from the anterior right side of eight juvenile summer steelhead and four juvenile winter steelhead trout. The total weight of the lipids was determined as the weight of the dried solvent phase. Fatty Acid Composition A portion of the lipid extract described above was methylated and a fraction of it injected into a Hewlett-Packard gas chromatograph using a hydrogen flame detector and a liquid phase of ethylene glycol succinate for analysis of the composition of fatty acids in the lipid sample from each fish. The oven temperature was 160 C and the helium carrier gas flow rate was 5 ml/min (Saddler et al. 1965, Lowry and Tinsely 1975). Peaks on the chart paper represent different fatty acids and were compared using the retention time from the injection point as a standard reference for peak identification (Figure 3). The area under each peak is proportional to the amount of that particular fatty acid in the total sample. Since varying amounts of methylated lipid extract were injected for different fish the peaks were analyzed as a relative percent of the total area for each fish. These relative percent values were pooled for all the summer steelhead and winter steelhead and the pooled samples were compared for differences. Figure 3. Gas chromatogram of fatty acids from a steeihead trout. 12 RESULTS Steelhead Trout Vertebral Number Wild juvenile summer steelhead trout had sign4ficantly (p<.05) fewer vertebrae than juvenile winter steelhead (Table 2). differences were insufficient to These allow separation of individual fish by race with 90% accuracy. The juvenile summer and winter steelhead trout from Cole Rivers Hatchery that were incubated and reared under the same conditions showed no difference in vertebral number. was 63.2 and The mean vertebral number 63.3 for summer and winter steelhead trout, respectively. Scale Characteristics A regression analysis of the relationship of scale radius on fork length showed differences (p<.001) between juvenile summer and winter steelhead trout (Table 3). A similar analysis of the relation- ship between scale radius and circuli number showed differences (p<A1) between juvenile summer and winter steelhead trout (Table Juvenile summer steelhead trout also had a larger scale nucleus (p<.01) and a greater average intracircular spacing (p<.001) than juvenile winter steelhead trout (Table 2). The size at first annulus formation, which was back-calculated using two different methods, showed that summer steelhead were significantly (p<.001) larger than juvenile winter steelhead (Table None of the differences in scale characteristics was sufficient Table 2. Selected taxonomic characteristics for juvenile summer and winter steelhead trout from the Rogue River. Total lipids (% of body weight) Vertebrae Race Summer steelhead Winter steelhead a Pooled Std. Std. Std. Collection site Mean error Galls Creek Sardine Creek Foots Creek Pooleda 62.4 62.6 63.4 62.8 0.3 0.3 23 22 0.1 22 67 Upper Illinois R. Lower Illinois R. Lobster and Quosatana Creek Pooleda 63.2 63.5 0.2 0.2 22 63.0 63.2 0.2 22 0.1 65 samples represent all samples from Ratio of mesentary fat to body weight n 0.2 a race error n Mean 1.67 0.27 8 0.027 2.06 0.43 Mean error 0.008 n 69 21 pooled 0.149 0.363 69 into a single comparison between races. Table 2 (continued) Scale nucleus radius (mm x 88) Race Summer steel head Winter steelhead Collection site Scale radius to first annulus n Mean error 30.2 33.1 2.0 1.5 0.1 22 22 22 66 34.7 32.5 1.7 1.0 5.6 0.3 0.2 20 23 28.5 32.8 2.0 5.4 5.7 0.4 0.2 20 63 28.7 30.0 error Galls Creek Sardine Creek Foots Creek Pooled4 6.2 6.2 5.9 0.3 0.3 0.3 6.1 Upper Illinois R. Lower Illinois R. Lobster and Quosatana Creek Pooleda 6.1 Std. Std. Std. Mean Ave. spacing to first annulus 1.9 2.8 1.2 n Mean error 22 22 22 66 1.78 1.74 1.75 0.05 0.04 0.03 0.03 22 22 22 66 20 23 1.58 1.69 0.06 0.04 20 23 20 63 1.59 1.63 0.11 20 63 1.71 0.03 aPooled samples represent all samples from a race pooled Into a single comparison between races. Table 3. Regressions of scale radius (mm x 88) on fork length for juvenile summer and winter steelhead trout from the Rogue River. Summer Steelhead Significance level Regression equation Race 66 Length = 3.3683 + 0.1719 0.836 18.041 p < .001 0.909 24.478 p (radius) Winter Steelhead 62 Length = 1.1596 + 0.2053 .001 (radius) Error sums of squares Model Fulla Reduceda 128 178 157.998 181.204 F 9.108 Significance level p < .001 aThe error sums of squares for the full model is the sum of the error sum of squares for both of the individual regressions. The error sum of squares, for the reduced model, is generated by pooling all data and calculating a pooled or "reduced" model. Table 4. Regressions of circuli number in scale radius (mm x 88) of juvenile summer and winter steelhead trout from the Rogue River. Race Summer Steelhead n 66 Regression equation Circull No.=3.0936 + 0.3929 Significance level R2 t 0.876 21.301 p < .001 0.890 22.068 p < .001 (radius) Winter Steelhead 62 Circuit No.=0.5814 + 0.4714 (radius) Full' Reduceda Si nificance level Error sums of_Ipares Model 128 128 802.344 885.869 6.454 p < .001 aThe error sums of squares for the full model is the sum of the error sum of squares for both model, is generated by of the individual regressions. The error sum of squares, for the reduced pooling all data and calculating a pooled or "reduced" model. Table 5. Length of juvenile summer and winter steelhead trout at first annulus formation, back-calculated using the Lee-Fraser direct proportion method and a scale radius vs. fork length regression method (see text). Mean length Race (cm) Significance Standard error level Lee-Fraser Method Summer Steelhead Winter Steelhead 65 8.95 0.19 39 7.50 0.22 65 8.96 0.17 6.52 p < .001 6.43 p < Regression Method Summer Steelhead Winter Steelhead 39 7.33 0.25 .001 17 to allow separation of individual fish by race with 90% accuracy. Mesentary Fat Deposition The amount of mesentary fat in juvenile steelhead was highly Since the size of the steelhead varied widely due to the variable. presence of older age class individuals, values for mesentery fat weight were expressed as milligrams of mesentary fat/gram of body weight. Winter steelhead had more fat on the average than did summer steelhead, but the variation was large (Table 2). Part of the high variation in values of mesentery fat was due to the difficulty in identifying and dissecting very small amounts of mesentery fat from small fish. In both summer and winter steelhead trout juveniles, the coefficient of variation was over 200% of the mean. The relationship of fat/body weight to condition factor showed a correlation coefficient of 0.14 and 0.12 for summer and winter steelhead trout, respectively (not significant at p < .05). Otolith Nuclear Diameter The diameter of the nucleus of the otoliths from juvenile summer and winter steelhead was measured three times because of inconsistency in identifying the metamorphic check enclosing the nucleus. Identification of the correct check became more difficult the longer the otoliths were allowed to clear in the glycerine-water solution. (p < After the first reading, there appeared to be a clear difference .001) between the juvenile summer and winter steelhead trout. In an effort to determine bias in interpretation, the collections were 18 randomly subsampled and the otoliths were reread without knowledge of the race beforehand. The results were dramatically different from the first readings, so the subsample was read again by a different, experienced otolith reader without knowledge of race beforehand. In each of the "blind" readings, the difference between summer and winter steelhead trout was not statistically significant. This indicated a major problem in interpreting which check to call the metamorphic check and which one to measure. This problem increased as the otolith cleared with more time in the clearing solution. Otoliths were measured from a sample of 25 summer and 25 winter steelhead trout juveniles incubated and reared under the same environmental conditions at Cole Rivers Hatchery. The mean diameter of the nucleus was 0.37 and 0.38 for summer and winter steelhead, respectively and did not differ significantly. Total Lipids No significant difference was observed in adjusted percent lipids in the muscle samples of the summer and winter steelhead trout juveniles (Table 6), Fatty Acid Composition There was no significant difference in mean relative percent of particular fatty acids between juvenile summer and winter steelhead trout (Table 7)0 Table 6. Total muscle lipids from summer and winter steelhead trout from the Rogue River. Mean lipid Race Stream composition (%) Standard error km n Foots Cr. 182 4 1.65 0.28 Galls Cr. 190 4 1.69 0.27 8 1.67 0.18 Summer Steelhead (pooled) 0.90 (NS) Winter Steelhead Indian Cr. 1 3 2.06 0.43 (NS) = not significant at p < .05. Co- Table 7. Relative amounts of 15 fatty acids in juvenile summer and winter steelhead trout from the Rogue Rivera. 10 Peak No. 11 12 13 14 15 16 Summer Steelhead Mean relative percent 0.51 1.67 0.29 1.53 25.63 1.74 6.25 0.76 -0.61 7.67 17.92 4.39 4.87 7.29 18.38 Standard error 0.19 0.24 0.06 0.31 1.37 0.35 1.37 0.08 0.37 1.94 0.43 0.58 0.93 2.06 8 8 8 8 8 8 8 8 0.09 8 8 8 8 8 8 8 (Winter Steelhead Mean relative percent 0.85 1.87 0.20 1.45 24.20 1.56 6.51 0.56 0.71 7.73 21.82 5.78 5.61 6.42 14.92 Standard error 0.61 o.66 0.06 0.40 0.41 o.41 2.16 0.11 0.35 0.92 4.65 2.88 1.68 1.8o 2.63 4 4 4 4 4 aAll comparisons showed no significant differences at p < 4 4 4 .05 between races. 4 4 4 4 4 4 4 21 Chinook Salmon Vertebral Number Juvenile fall chinook salmon had significantly (p < .01) higher vertebral counts than spring chinook salmon juveniles (Table 8). These differences were not sufficient to allow separation of individual fish with 90% accuracy. Scale Characteristics The regression of scale radius on fork length for the chinook samples showed no significant difference between spring and fall chinook juveniles (Table 9). A similar comparison of regressions of scale radius on circuli number showed differences (p < .001) between the races of chinook salmon (Table 10). There were also large differences in average intracircular spacing (p < .01) and the radius of the scale nucleus (p < .05) with spring chinook salmon larger in both respects than fall chinook salmon juveniles (Table 8). Juvenile spring chinook had signifi- cantly larger first and second bands of five intracircular spaces (p < .001 and p < .05 respectively) than juvenile fall chinook salmon (Table 8). Mesentar Fat Deposition The weights of mesentery fat dissected from the juvenile chinook salmon were highly variable (Table 8). The coefficient of variation for mean weight of mesentery fat ranged from approximately 150% to 300%. The fall chinook samples also included the Applegate River Table 8. Selected taxonomic characteristics of juvenile spring and fall chinook salmon from the Rogue River. Race Spring Chinook Fall Chinook Collection site Mesentery fat Otolith nuclear diameter Vertebrae (mg) Std. Std. Std. n Mean error n Mean error n 68.4 0.2 0.2 0.2 22 22 22 0.62 0.63 0.58 68.4 0.1 66 0.61 0.01 0.01 0.01 0.01 16 19 18 53 0.52 0.30 0.63 0.48 0.42 0.25 0.16 0.17 23 23 23 69 68.7 68.7 0.2 0.2 23 0.61 20 3.74 19 0.1 0.24 0.17 0.70 0.54 0.10 0.57 23 23 23 68.8 0.58 0.59 0.59 0.11 0.2 23 23 69 19 69.0 0.01 0.01 0.01 0.01 Mean error Sand Hole Table Rock High Banks Pooleda 68.3 Applegate R. Lobster Cr. Quosatana Cr. Pooleda 68.4 58 46b OM. aPooled samples represent all samples from a race pooled for a single comparison between races. bApplegate sampled excluded (see text). Table 8. (continued) Ave. intr. spacing Scale nuclear diameter Race Spring chinook Fail Chinook Mean Sand Hole Table Rock High Banks Pooled 5.4 6.5 6.3 6.2 Applegate R. Lobster Cr. Quosatana Cr. Pooled 6.0 5.4 5.9 5.8 Std. Std. Std. Std. Collection site 2nd band width 1st band width n Mean 14 12.0 10.6 n Mean error n Mean error 0.3 0.3 0.2 0.2 22 22 22 66 2.37 2.42 2.53 2.44 0.06 0.10 0.05 0.05 22 22 13.4 22 66 14.3 13.6 0.6 0.9 0.4 0.3 59 0.2 0.2 0.2 23 23 23 69 2.34 2.16 2.03 2.17 0.05 0.08 0.06 0.04 23 23 23 69 13.0 11.9 11.3 12.0 0.3 0.4 0.3 0.2 23 23 23 69 error 0.1 13.1 22 23 error - n 1 15 12 10.8 0.4 0.5 0.3 11.0 9.8 9.6 10.2 0.3 0.4 0.5 0.2 21 8 11.1 aPooled samples represent all samples from a race pooled for a single comparison between races. bApplegate sample excluded (see text). 28 23 52 Table 9. Regressions of scale radius on fork length of juvenile spring and fall chinook salmon from the Rogue River, Regression equation Race R2 t Significance level Spring chinook salmon 63 Length (cm)=2.2262 + 0.18486 Scale radius(mm x 88) 0.7859 14.96 p < .001 Fall chinook salmon 69 Length (cm)= 2.9262 + 0.16094 Scale radius(mm x 88) 0.6117 10.27 p < Model n Fulla 132 Error sums of squares F 132 Significance level 78.795 0.7448 Reduced' .001 NS = not significant at p < .05 79.712 dThe error sums of squares for the full model is the sum of the error sums of squares for both of generated by the individual regressions. The error sum of squares for the reduced model is pooling all data and calculating a pooled or "reduced" model. Table 10. Regressions of scale radius on circuli number for juvenile spring and fall from the Rogue River. Spring chinook salmon 63 radius = 5.0759 4. 2.5648 69 radius = mm x 88) t Significance level 0.7651 14.096 P < .001 0.6688 11.633 p < .001 (circuli number) (mm x 88) Fall chinook salmon R2 Regression equation Race chinook 9.8254 + 1.8206 (circuli Error sum of squares Model n Fulla 132 173.337 Reduceda 132 210.012 number) F 13.542 Significance level p < .001 indiviaThe error sum of squares for the full model is the sum of the error sum of squares for the two data The error sum of squares for the reduced model is generated by pooling all dual regressions. and calculating a pooled or "reduced" model. 25 samples which were seined from the stream and reared for a short period at Cole Rivers Hatchery. The influence of the hatchery rearing caused the mesentary fat amounts to be 15 times larger than the next largest values for wild fall chinook salmon juveniles. This indicates that differences In food supply can quickly and drastically affect the mesentary fat amounts, regardless of race. Mesentary fat was poorly correlated to condition factor, with a correlation coefficient of 0.14 and 0.05 for fall and spring chinook respectively. Otolith Nuclear Diameter The nucleus of the otoliths of chinook salmon juveniles was easily identified and measured. Unlike the steelhead trout samples, there was little problem with interpretation and measurements did not change with additional readings. The coefficient of variation was 6.7% and 7.1% for spring and fall chinook salmon juveniles, respectively. There were significant (p < .05) differences between spring and fall chinook juveniles, but these differences were insufficient to allow separation of individual fish by race with 90% accuracy (Table 8). 26 DISCUSSION Wild juvenile summer steelhead trout had fewer vertebra, a larger scale nucleus, greater average intracircular spacing on scales, and a larger size at first annulus formation than juvenile winter steelhead trout. The differences in the number of vertebrae were not seen in juvenile summer and winter steelhead trout which were incubated and reared under the same conditions at Cole Rivers Hatchery, indicating that differences noted in the field samples were primarily due to environmental effects. There were also differences between juvenile spring and fall chinook salmon from the Rogue Basin. Fall chinook exhibited higher vertebral number, smaller otolith nuclear diameter, lower average spacing on scales, smaller scale nuclei and smaller first and second band widths than juvenile spring chinook salmon. The differences in most of the scale characteristics between the races of salmon and trout were probably due to differences in growth in the first year of life (Reimers 1973). Summer steelhead emerge from the gravel earlier than winter steelhead trout (Everest 1973). In addition, summer steelhead trout rear in the main stem of the Rogue and some of the low elevation tributaries, while winter steelhead trout rear for most of their first year in less productive headwater streams (Rivers 1963; Everest 1973). Spring chinook salmon emerge earlier than fall chinook salmon and usually show superior growth during the early months of freshwater rearing (Cramer, unpublished data). Differences between races 27 in growth are subject to environmental variability and are not considered to be extremely stable between years, indicating that scale characteristics would be less consistently useful to the manager in separating juvenile salmonids by race than other characteristics under less environmental control. Mesentery fat was not a useful character for separating wild juvenile salmonids from the Rogue River Basin by race. Amounts of mesentery fat varied greatly between fish from the same stream. This is probably due to the variability in food availability and social position of the particular fish. Smith (1969) used this characteristic to separate juvenile summer and winter steelhead trout that had been reared together in a hatchery. The hatchery feeding situation probably allowed the accumulation of much greater amounts of mesentery fat than fish could accumulate in the wild. This Is also indicated by the much greater amount of mesentery fat accumulated by the Applegate River chinook salmon juveniles during their short period of rearing at Cole Rivers Hatchery compared to the other wild chinook juveniles, regardless of race. Differences in otolith nuclear diameter between races of salmon and steelhead in the Rogue Basin were minor or nonexistent. In no using this case could individual fish be separated with 900 accuracy character. and Koski Otolith nuclear diameter as described by McKern, Horton (1974) was distributed in a widely separated bimodal dis- tribution which allowed them to separate adult summer and winter steelhead trout with 90% accuracy. They hypothesized that this 28 differences was due to differences in egg size which was a genetic trait of the races throughout the Pacific Northwest, but these differences were not found in samples from the Rogue River basin. McKern and Horton make no mention of multiple checks in the nuclear area, causing problems with interpretation. Part of the discrepancy may be because they used otoliths from adult steelhead while all of my samples were from juveniles. Otoliths from juveniles clear much more rapidly, and as they cleared, additional checks began to appear in the nuclear area of the otolith. Another possibility is that Rogue steelhead are more variable in size than most stocks from the Pacific Northwest and may have a greater variability in egg size causing variability in otolith nuclear diameter. This possibility does not account for the multiple checks in the nuclear area. As mentioned earlier, the usefulness of differences between races in taxonomic characters to the fishery manager depends on the magnitude of the differences, which determine how accurately individual fish can be identified by race, and the genetic basis for these differences. The goal of separation of individual fish with 90% accuracy can be achieved if a characteristic differs between races such that the 90% confidence intervals for individual observations (mean + "t" standard deviations) do not overlap. No characteristic or combi- nation of characteristics studied were distributed in this manner in the chinook salmon or steelhead trout from the Rogue River basin. Differences in taxonomic characters may indicate genetic isola- 29 tion of races and may be a response to genetic drift or directional Races of salmonids in natural selection (Ricker 1969; Smith 1969). the Rogue basin seem to segregate in spawning areas and to some extent in rearing areas, thus differences could be caused by different environmental conditions in the early life history. This hypo- thesis was suggested by the lack of differences in vertebral number in the summer and winter steelhead trout juveniles incubated and reared together at Cole Rivers Hatchery. In a similar experiment, Smith (1969) showed differences between summer and winter steelhead He concluded that trout from the Capilano River, British Columbia. these differences indicated genetic isolation of the races of steelhead trout. Because my samples were collected from different segregated spawning areas of adult salmonids, I was not able to determine if the differences in characteristics were the effect of genetics, environment or both. The genetic isolation of races of chinook salmon and steelhead trout in the Rogue basin may be a response to differences in spawning timing and habitat or area (Rivers 1963; Everest 1973; Lichatowich 1976). Isolating mechanisms break down and interbreeding between races occurs in years of environmental extremes. In 1977, for example, a draught caused summer steelhead trout to spawn in the main stem of the Rogue River and larger tributaries that are usually only used by winter steelhead trout. Warmer water temperatures in the fall of 1977 caused adult fall chinook salmon to migrate higher in the Rogue system than usual and it is probable that they interbred 30 more with spring chinook salmon than usual. The Rogue River is characteristically highly variable in flow and temperature during the spawning seasons of chinook salmon and steelhead trout, and it is likely that a considerable amount of interbreeding between races occurs in many years. This interbreeding may contribute to a large amount of diversity and variation, which of may be why investigators have been unable to separate the races steelhead trout or chinook salmon from the Rogue on the basis of isoenzyme patterns (Oregon Cooperative Fishery Research Unit, 1977). of extensive In a stream system like the Rogue, with the possibility racial interbreeding and highly variable environmental conditions, it characteristics is not surprising that morphological and life history between of juvenile salmonids are highly variable and differences races are not distinct. 31 BIBLIOGRAPHY 1959. A rapid method of total lipid Bligh, E. G., and W. J. Dyer. extraction and purification. Can, J. Biochem. Physiol. 37: 911-917. Collection and interpre1956. Clutter, R. I., and L. E. Whitesel. Bulletin IX International tation of sockeye salmon scales. New Westminster, B. C. Canada. Pacific Salmon Commission. 159 PP. Ecology and management of summer steelhead 1973. Everest, F. H. Oregon State Game in the Rogue River. Fish. Res. Rep. No. 7. Commission, Corvallis, Oregon. 48 pp. 1963. The use of otoliths for age Kim, W. S., and T. S. Y. Koo. Fish. Res. Inst., Univ. Wash., determination in red salmon. Contrib. 147:17-19. Seattle. 1976. Rogue basin evaluation program annual Lichatowich, J. A. report to: U. S. Army Corps of Engineers, Portland, Oregon. Research Section, Oregon Department of Fish and Wildlife, Corvallis, Oregon. 68 pp. 1975. Open tabular columns for Lowry, R. R., and I. J. Tinsley. gas liquid chromatography:cleaning and recoating procedures. J. Am. Oil Chem. Soc. 52:298-299. 1974. Development McKern, J. L., and H. F. Horton and K. V. Koski. otoliths and their use for of steelhead trout (Salm° gairdneri) age analysis and for separating summer from winter races and J. Fish. Res. Bd. Can. 31:1420-1426. wild from hatchery stocks. Applied linear statistical 1974. Neter, J., and W. Wasserman. Inc. Homewood, Ill. 842 pp. Richard D. Irwin, models. Biochemical 1976. Oregon Cooperative Fishery Research Unit. genetic variation in Rogue River chinook salmon (Oncorhynchus Rogue tshawytscha) and steelhead trout (Salmo gairdneri). to: U. S. Army 2) (Part Basin Evaluation Program, Annual Report Research Section, Oregon Portland, Oregon. Corps of Engineers, 61 pp. Wildlife, Corvallis, Oregon. Department of Fish and chinook salmon in Reimers, P. E. The length of residence of fall Res. Rep. of the Fish Comm. of Ore. Vol. Sixes River, Oregon. 42 pp. 4. 32 Hereditary and environmental factors affecting 1972. Ricker, W. E. certain salmonid populations. Pages 19-160 in R. Simon and P. H. R. Larkin, eds. The stock concept in Pacific salmon. MacMillan lectures in fisheries, University of British Columbia, Vancouver, B.C. 1963. Rogue River Fisheries. Unpublished report, Oregon State Game Commission, Portland, Oregon. 250 pp. typewritten. Rivers, C. Use of Rybock, J. T., H. F. Horton and J. L. Fessler. 1975. otoliths to separate juvenile steelhead trout from juvenile rainbow trout. Fish. Bull. 73:654-659, DistriSaddler, J. B., R. Lowry, H. Krueger and I. Tinsley. 1965. acids from the coho bution and identification of the fatty J. Am. Oil salmon, Oncorhynchus kisutch (Walbaum). Chem. Soc. 43:321-324. 1969. Reproductive isolation in summer and winter Smith, S. B. races of steelhead trout. Pages 21-38 in T. G. Northcote ed. H. R. MacMillan Symposium on salmon and trout in streams. lectures in fisheries, University of British Columbia, Vancouver, B.C. 1971. Age and Growth. Pages 98-130 in W. E. Ricker Tesch, F. W. Methods for assessment of fish production in fresh waters. ed. Oxford. IBP Hand Book No. 3, Blackwell Scientific Publications,
