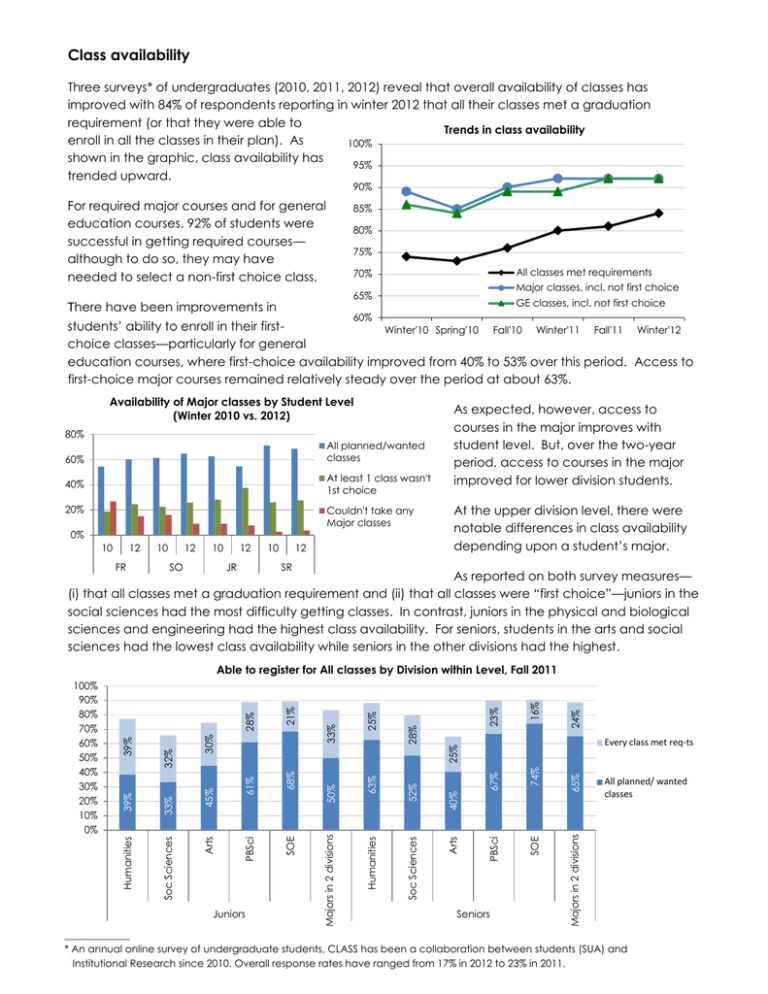
Availability of Major classes by Student Level (Winter 2010 vs. 2012)
advertisement

Class availability Three surveys* of undergraduates (2010, 2011, 2012) reveal that overall availability of classes has improved with 84% of respondents reporting in winter 2012 that all their classes met a graduation requirement (or that they were able to Trends in class availability enroll in all the classes in their plan). As 100% shown in the graphic, class availability has 95% trended upward. 90% For required major courses and for general education courses, 92% of students were successful in getting required courses— although to do so, they may have needed to select a non-first choice class. 85% 80% 75% All classes met requirements 70% Major classes, incl. not first choice 65% There have been improvements in GE classes, incl. not first choice 60% students’ ability to enroll in their firstWinter'10 Spring'10 Fall'10 Winter'11 Fall'11 Winter'12 choice classes—particularly for general education courses, where first-choice availability improved from 40% to 53% over this period. Access to first-choice major courses remained relatively steady over the period at about 63%. Availability of Major classes by Student Level (Winter 2010 vs. 2012) 80% All planned/wanted classes 60% At least 1 class wasn't 1st choice 40% 20% Couldn't take any Major classes 0% 10 12 FR 10 12 10 SO 12 JR 10 12 As expected, however, access to courses in the major improves with student level. But, over the two-year period, access to courses in the major improved for lower division students. At the upper division level, there were notable differences in class availability depending upon a student’s major. SR As reported on both survey measures— (i) that all classes met a graduation requirement and (ii) that all classes were “first choice”—juniors in the social sciences had the most difficulty getting classes. In contrast, juniors in the physical and biological sciences and engineering had the highest class availability. For seniors, students in the arts and social sciences had the lowest class availability while seniors in the other divisions had the highest. 24% 16% 23% Every class met req-ts Seniors SOE 65% All planned/ wanted classes Majors 2 div-ns Majors in in 2 2 divisions divisions 74% 67% PBSci 40% Arts 52% Soc Sciences 63% Humanities 68% 50% Majors in 2 divisions 2 div-ns Juniors SOE PBSci 61% 25% 28% 25% 33% 21% 30% 45% Arts 33% Soc Sciences 32% 39% Humanities 39% 28% Able to register for All classes by Division within Level, Fall 2011 100% 90% 80% 70% 60% 50% 40% 30% 20% 10% 0% _____________ * An annual online survey of undergraduate students, CLASS has been a collaboration between students (SUA) and Institutional Research since 2010. Overall response rates have ranged from 17% in 2012 to 23% in 2011.


