Package ‘metaFunction’ June 20, 2014
advertisement
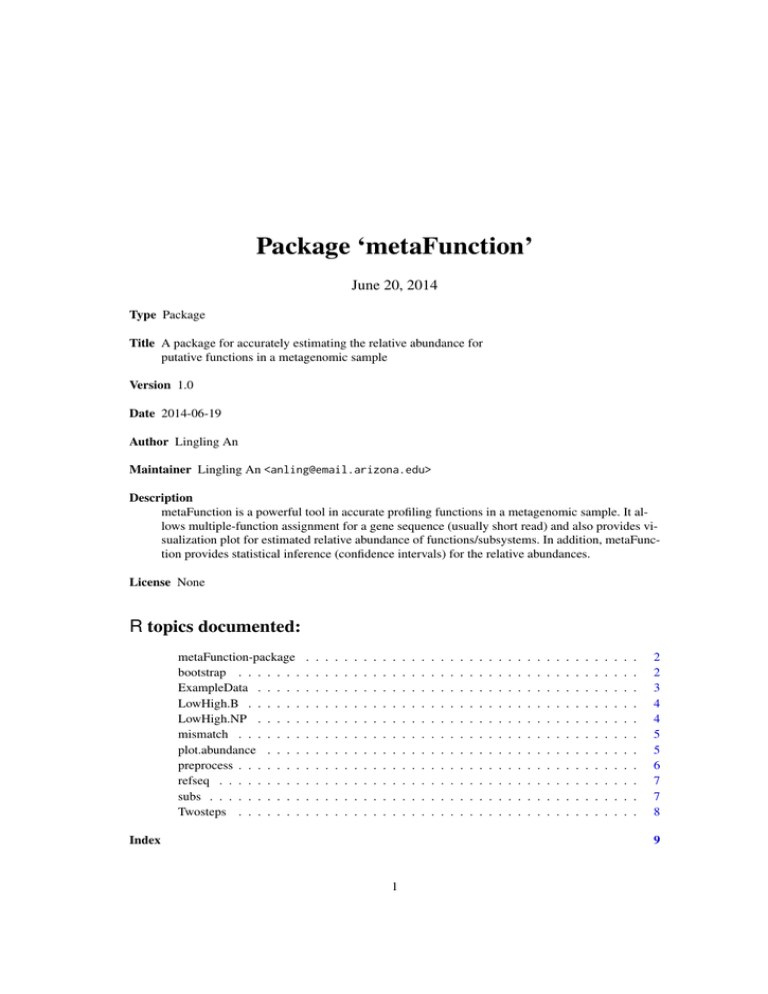
Package ‘metaFunction’ June 20, 2014 Type Package Title A package for accurately estimating the relative abundance for putative functions in a metagenomic sample Version 1.0 Date 2014-06-19 Author Lingling An Maintainer Lingling An <anling@email.arizona.edu> Description metaFunction is a powerful tool in accurate profiling functions in a metagenomic sample. It allows multiple-function assignment for a gene sequence (usually short read) and also provides visualization plot for estimated relative abundance of functions/subsystems. In addition, metaFunction provides statistical inference (confidence intervals) for the relative abundances. License None R topics documented: metaFunction-package bootstrap . . . . . . . ExampleData . . . . . LowHigh.B . . . . . . LowHigh.NP . . . . . mismatch . . . . . . . plot.abundance . . . . preprocess . . . . . . . refseq . . . . . . . . . subs . . . . . . . . . . Twosteps . . . . . . . . . . . . . . . . . . . . . . . . . . . . . . . . . . . . . . . . . . . . . . . . . . . . . . . . . . . . . . . . . . . . . . . . . . . . . . . . . . . . . . . . . . . . . . . . . . . . . . . . . . . . . . . . . . . . . Index . . . . . . . . . . . . . . . . . . . . . . . . . . . . . . . . . . . . . . . . . . . . . . . . . . . . . . . . . . . . . . . . . . . . . . . . . . . . . . . . . . . . . . . . . . . . . . . . . . . . . . . . . . . . . . . . . . . . . . . . . . . . . . . . . . . . . . . . . . . . . . . . . . . . . . . . . . . . . . . . . . . . . . . . . . . . . . . . . . . . . . . . . . . . . . . . . . . . . . . . . . . . . . . . . . . . . . . . . . . . . . . . . . . . . . . . . . . . . . . . . . . . . . . . . . . . . . . . . . . . . . . . . . . . . . . . . . . 2 2 3 4 4 5 5 6 7 7 8 9 1 2 bootstrap metaFunction-package metaFunction is a package for accurately estimating the relative abundance for putative functions in a metagenomic sample What the package does (short line) Description metaFunction is a powerful tool in accurate profiling functions in a metagenomic sample. It allows multiple-function assignment for a gene sequence (usually short read) and also provides visualization plot for estimated relative abundance of functions/subsystems. In addition, metaFunction provides statistical inference (confidence intervals) for the relative abundances. Details Package: Type: Version: Date: License: metaFunction Package 1.0 2014-06-19 What license is it under? Author(s) Lingling An Maintainer: Lingling An <anling@email.arizona.edu> bootstrap Bootstrap Method for Confidence Interval Calculation Usage bootstrap(original, boot.n, epsilon, method) Arguments original boot.n epsilon method The preprocessed data from blast output. bootstrap size, i.e., how many resamplings need to do? Small probability for controling the multiple function assignment, see the function "Twosteps". Two methods for calculating the confidence intervals: non-parametric way and Bonferroni method. Details Two methods are provided for calculating the confidence interval based on the bootstrap results: 1) non-parametric way, i.e, no correction for multiple/simulteneous confidence intervals. 2) Bonferroni method for correction of simulteneous confidence intervals. ExampleData 3 Examples library(metaFunction) require(data.table) require(mefa) require(lattice) data(ExampleData) data(refseq) data(subs) pre=preprocess(ExampleData) epsilon=0.01 est=Twosteps(pre, epsilon) bootsize=100 boot.data=bootstrap(pre, bootsize, epsilon, method="B") ExampleData Example Data Description An example dataset is provided for checking the functions in the metaFunction package. Usage data(ExampleData) Format A data frame with 651661 observations on the following 19 variables. Details Blastx output which is generated from format 7. Other formats can be used too after modify a little on the names of input data in the function of "preprocess". Examples data(ExampleData) ## maybe str(ExampleData). 4 LowHigh.NP Bonferroni correction for simultaneous confidence intervals. LowHigh.B Description The input is the output from the bootstrap function. Usage LowHigh.B(x, y) Arguments x Estimated relative abundances for the functions/subsytems from the Twostep method on the preprocessed dataset. y Bootstrap results of relative abudances for the functions/subsytems.Note: each boostrap result is obtained by Twostep method. Examples x.value=c(0.01, 0.05, 0.1, 0.2, 0.3, 0.34) fname=c("feature1","feature2","feature3","feature4","feature5","feature6") x=data.frame(name=fname, value=x.value) temp=t(sapply(x.value, function(i)(rnorm(100,i, i/10)))) y.value=sapply(1:dim(temp)[2], function(i)(temp[,i]/sum(temp[,i]))) y=data.frame(name=fname, value=y.value) LowHigh.B(x,y) Non-parametric way for confidence intervals LowHigh.NP Description The input is the output from the bootstrap function. Usage LowHigh.NP(x, y) Arguments x Estimated relative abundances for the functions/subsytems from the Twostep method on the preprocessed dataset. y Bootstrap results of relative abudances for the functions/subsytems.Note: each boostrap result is obtained by Twostep method. mismatch 5 Examples x.value=c(0.01, 0.05, 0.1, 0.2, 0.3, 0.34) fname=c("feature1","feature2","feature3","feature4","feature5","feature6") x=data.frame(name=fname, value=x.value) temp=t(sapply(x.value, function(i)(rnorm(100,i, i/10)))) y.value=sapply(1:dim(temp)[2], function(i)(temp[,i]/sum(temp[,i]))) y=data.frame(name=fname, value=y.value) LowHigh.NP(x,y) mismatch Calculation of Maximum Mismatches Description Assume a binomial distribution for the number of mismathed codons, calculate the maximum allowed matches to meet the pre-specified small probability. Usage mismatch(Length, CM, p, epsilon) Arguments Length Length of a short read. CM Maximum perfect matches for a short read across multiple returns in Blastx ouput. p Error estimated from the mixture model. epsilon A pre-specified small probability. Examples mismatch(32, 32, 0.15, 0.05) plot.abundance Generate plots for estimated relative abundances of functions/subsystems. Description Visulizing the relative abundances of the functions or subsysems in a metagenomic sample. 95% confidence intervals for the abundances obtained from bootstrap resampling method are added as error bars. Usage plot.abundance(boot.dat) 6 preprocess Arguments boot.dat The output from bootstrap resampling method. Examples library(metaFunction) require(data.table) require(mefa) require(lattice) data(ExampleData) data(refseq) data(subs) pre=preprocess(ExampleData) epsilon=0.01 bootsize=100 boot.data=bootstrap(pre, bootsize, epsilon, method="B") plot.abundance(boot.data) Preprocess the output data from Blastx preprocess Description Preprocess the data from Blastx output. Usage preprocess(x) Arguments x blastx output Details Depends on the blastx format for alignment, the input data for the function "preprocess" could be modified a little bit to accompany with the blastx output. Examples library(metaFunction) require(data.table) require(mefa) require(lattice) data(ExampleData) data(refseq) data(subs) pre=preprocess(ExampleData) refseq refseq 7 Built in dataset Description Mapping information between accesssion number and functional roles. Usage data(refseq) Format A data frame with 1693417 observations on the following 3 variables. AccessionNumber a character vector FunctionRole a character vector ID a character vector Examples data(refseq) ## maybe str(refseq) ; plot(refseq) ... subs Built in dataset Description Mapping inforamtion between the functional roles and different levels of subsystems. Usage data(subs) Format A data frame with 12808 observations on the following 4 variables. sub3 a character vector sub1 a character vector sub2 a character vector FunctionRole a character vector Examples data(subs) ## maybe str(subs) ; plot(subs) ... 8 Twosteps Main function for estimating the relative abundances of functions/subsystems in a metagenomic sample Twosteps Description This function contains two steps: mixture model for estimating (sequencing) error and binomial distribution for determing the multiple function assignment. Usage Twosteps(mydata0, epsilon) Arguments mydata0 Input data from the output of the preprocess function. epsilon A small probability for adusting the function assignment. Examples library(metaFunction) require(data.table) require(mefa) require(lattice) data(ExampleData) data(refseq) data(subs) pre=preprocess(ExampleData) epsilon=0.01 est=Twosteps(pre, epsilon) Index ∗Topic \textasciitildekwd1 bootstrap, 2 LowHigh.B, 4 LowHigh.NP, 4 mismatch, 5 plot.abundance, 5 preprocess, 6 Twosteps, 8 ∗Topic \textasciitildekwd2 bootstrap, 2 LowHigh.B, 4 LowHigh.NP, 4 mismatch, 5 plot.abundance, 5 preprocess, 6 Twosteps, 8 ∗Topic datasets ExampleData, 3 refseq, 7 subs, 7 ∗Topic package metaFunction-package, 2 bootstrap, 2 ExampleData, 3 LowHigh.B, 4 LowHigh.NP, 4 metaFunction (metaFunction-package), 2 metaFunction-package, 2 mismatch, 5 plot.abundance, 5 preprocess, 6 refseq, 7 subs, 7 Twosteps, 8 9


