Document 10904328
advertisement
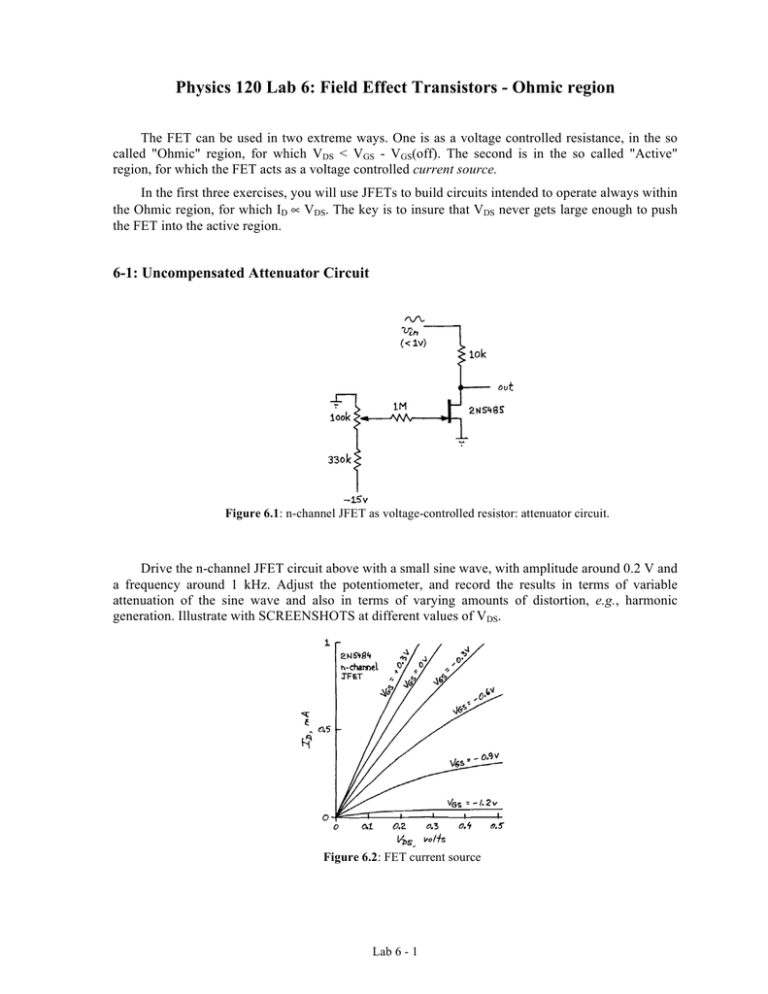
Physics 120 Lab 6: Field Effect Transistors - Ohmic region The FET can be used in two extreme ways. One is as a voltage controlled resistance, in the so called "Ohmic" region, for which VDS < VGS - VGS(off). The second is in the so called "Active" region, for which the FET acts as a voltage controlled current source. In the first three exercises, you will use JFETs to build circuits intended to operate always within the Ohmic region, for which ID ∝ VDS. The key is to insure that VDS never gets large enough to push the FET into the active region. 6-1: Uncompensated Attenuator Circuit Figure 6.1: n-channel JFET as voltage-controlled resistor: attenuator circuit. Drive the n-channel JFET circuit above with a small sine wave, with amplitude around 0.2 V and a frequency around 1 kHz. Adjust the potentiometer, and record the results in terms of variable attenuation of the sine wave and also in terms of varying amounts of distortion, e.g., harmonic generation. Illustrate with SCREENSHOTS at different values of VDS. Figure 6.2: FET current source Lab 6 - 1 6-2: Compensated Attenuator Circuit Figure 6.3: Compensated FET as a voltage controlled resistor Adding ½ 𝑣!" to the gate will "linearize" the ID-VDS curves a good deal; see class notes on this amendment to the circuit. Document, with a SCREENSHOT, the effect on the shape of Vout as you again drive the circuit with a triangle waveform of ~ 0.2 Volt amplitude and ~ 1 kHz in frequency. 6.3: Modulation ( Keep this circuit intact for use with Laboratory 9!) We now consider modulation of a high frequency sine (carrier wave) by a low frequency sine (modulation wave). Mind the polarity of the 1 µF electrolytic capacitor as you assemble this circuit. Use the audio generator add an "AC" component to the "DC" component that you drove with the potentiometer in exercise 6.2. This "AC" signal will modulate the attenuation provided by the FET. Choose the frequency of modulation be much lower than the signal, or carrier frequency. Start with fmodulation ~ 2 kHz (or less) with a small amplitude, i.e., ~ 0.2 V, and fcarrier ~ 500 kHz with an amplitude less than 1 Volt. Figure 6.4: Amplitude-modulation of a carrier signal, or multiplication of one signal by another, using a voltage controlled resistor with "DC" and "AC" control voltages. For a stable display, you will want to trigger the oscilloscope on the modulating signal and not on the composite output. Feel free to go wild (!) with different modulation amplitudes and frequencies, but for your own edification, document the output(s) with SCREENSHOTS. When does the circuit fail to function properly? Lab 6 - 2 We now switch (no pun intended) to the use of MOSFETS to act at "switches" 6-4: Power MOSFETs Figure 6.5: ID versus VGS for the n-channel MOSFET is shifted to positive voltages. This exercise involves the control of relatively large currents with a "power" enhancement mode n-channel MOSFET. We utilize this MOSFET as an integrated analog switch Figure 6.6: Power MOSFET transistor switch Figure 6.7: MOSFET switching circuit Build the circuit shown above. Use a #47 lamp as load (incandescent lamps are useful as a teaching aid as their I-V characteristics are non-linear) and confirm that the MOSFET switches when driven through the 10 kΩ resistor at low frequencies; toggle the input between 0 and +5 V by hand. High input impedance is the MOSFET’s great strength, so the gate will stay charged if not grounded. Can you estimate how long the charge will remain? 6.5: CMOS as Solid State Switches CMOS switches are formed by the parallel combination of n-channel and p-channel MOSFETs, so that the combination can conduct both positive and negative going analog signals. Schematically, the CMOS analog switch is extremely simple: it does or does not pass a signal. Figure 6.8: Generic picture of an analog switch. Lab 6 - 3 The switch we will use has especially nice properties. It is switched by standard logic voltages, 0 and +5 V (OFF = 0 V and ON = +5 V). It can handle an analog signal anywhere in the range between its positive and negative supply voltages, which we put at ±15 Volts. Lastly, it is a double-throw type, which is suited to select between two sources or destinations. Figure 6.9: DG403 analog switch: block diagram and pin out. Each package contains two switches; tie the unused “IN” terminal to ground or to +5 V to ensure that the input to the switch does not hang at a midpoint voltage that can cause excessive heating. Let's get on with the exercise. Ideally, the switch should be a short when it is ON. In fact, it shows a small resistance, called RON. Measure RON, using the setup shown below: Figure 6.10: RON measurement Use a 1 kHz sine wave at a few Volts as the analog source. Use a wire that you can connect either to ground or to +5 Volts as source of the “digital” signal to turn the CMOS switch ON or OFF. Confirm that the switch does turn ON; demonstrate this and document with a SCREENSHOT. Discuss how you can measure RON, and do so. Make a sketch and show a SCREENSHOT to document your measurement. Note: Use scope probes. Lab 6 - 4 6.6 Feed-through for a CMOS Analog Switches The circuit below makes the switch perform better: its RON is negligible relative to the 100 kΩ resistor. Confirm this and document with a SCREENSHOT. When the switch is OFF, does the signal pass through the switch? Try a high-frequency sine (~ 20 kHz and ~ 2 MHz) and document your results with SCREENSHOTs. If signals pass through the OFF switch, why do they pass? Figure 6.11: More typical application circuit (RON made negligible) Note: You are looking at the output with a scope probe whose capacitance to ground, Cin, may be more important than its large Rin! 6.7 Sample & Hold - An example for a CMOS Analog Switches This application is used to sample a changing waveform, "holding" the sampled value while some process occurs, such as conversion from analog into digital form. Figure 6.12: Sample and hold Build the above circuit (don't forget that the Op-Amp requires ±15 V power). Demonstrate the "hold" and document with a SCREENSHOT. Can you infer from the droop of the signal when the switch is in hold position what leakage paths dominate? This is not a simple question, in that multiple sources of leakage current may contribute. But give it your best effort, describe your thinking and, if possible, set up a test to confirm or disprove your idea(s). How does one choose the value of the storage capacitor (100 pF above)? What good effects, and what bad effectc, would arise from the choice of a capacitor that was very large? Very small? Can you spot the effect of charge injection from the CMOS switch immediately after a transition on the control input? This may be simplest to accomplish with a square wave as the input signal and triggering the oscilloscope off of the op amp (be patient - it may take multiple trials to "trap" this effect). Document this with a SCREENSHOT. Compare the voltage effect you would predict, given the specification Qinject ≤ 60 pC and the value of your storage capacitor, with the observed value. Lab 6 - 5
