Document 10891745
advertisement
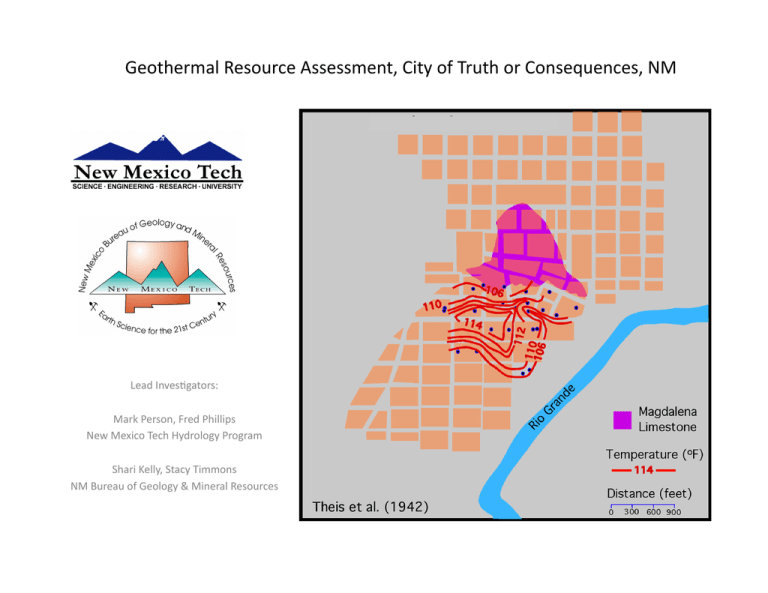
Geothermal Resource Assessment, City of Truth or Consequences, NM Lead Inves>gators: Mark Person, Fred Phillips New Mexico Tech Hydrology Program Shari Kelly, Stacy Timmons NM Bureau of Geology & Mineral Resources Update 1. 5-­‐Year, $20M, Na>onal Science Founda>on Project on Alterna>ve Energy Development in NM Funded with $1.5M going to Geothermal Energy Research. Work will con>nue beyond October, 2013 on this study at no cost to the City. Thank you Mayor Mulcahy for le[er of support that was used in our proposal. 2. GPS Survey & Water Table Contour Maps 3. Spa District Temperature Maps 4. 14C Groundwater Residence Times 5. Electrical Resis>vity Study of Alluvial Aquifer Near Rio Grande 6. Preliminary Cross-­‐Sec>onal Hydrothermal Model Results (two scenarios: 1) Low Permeability; 2) High Permeability Crystalline Basement 7. Preliminary 3D MODFLOW Groundwater Flow Model Results Water Level Measurements Surveying Temperature Measurements Geochemical Sampling Differen>al GPS Survey • Dr. Mark Murray • 5 cm scale resolu>on • ~ 30 wells around town, airport well, … Eleva>on: Top of Well Casing ID Eleva>on (m) Eleva>on (d) TC-­‐12 TC-­‐13 TC-­‐19 TC-­‐2 TC-­‐20 TC-­‐21 TC-­‐22 TC-­‐25 TC-­‐26 TC-­‐28 1294.475 1292.403 1293.875 1291.185 1293.723 1293.376 1293.116 1295.333 1294.237 1294.846 4246.965 4240.167 4244.997 4236.171 4244.498 4243.360 4242.507 4249.780 4246.184 4248.182 TC-­‐30 1295.515 4250.377 TC-­‐31 1294.635 4247.490 TC-­‐37 1293.469 4243.665 TC-­‐38 TC-­‐46 TC-­‐48 TC-­‐51 TC-­‐52 TC-­‐58 TC-­‐60 TC-­‐61 TC-­‐62 TC-­‐63 TC-­‐66 TC-­‐67 TC-­‐74 TC-­‐77 1293.450 1292.819 1293.140 1293.041 1294.666 1294.502 1293.734 1293.571 1470.243 1292.745 1375.566 1293.233 1317.948 1324.053 4243.602 4241.532 4242.585 4242.260 4247.592 4247.054 4244.532 4243.999 4823.632 4241.289 4510.562 4242.890 4323.976 4344.006 Water Table Map, March 22nd 2013 May revise using hand contouring Comparison of Theis et al. (1941) and 2013 Water Table Maps Similar Range & Pa[erns, No large scale cone of depression observed due to pumping 2013 Water table is higher by 3 feet. This may be due to changes in datum (sea level) Comparison of 2013 Temperature Map at Water Table and Theis et al. (1941) Discharge Temperature Map 2013 Highest Water Table Temperatures are to the East of Theis et al. (1941) Thermal Maximum But note that deep well that defined Theis’ thermal maximum does not exist today! Comparison of 2013 Temperature Map 8m Below Water Table and Theis et al. (1941) Discharge Temperature Map Again 2013 Highest Temperature 8m Below Water Table is to the East of Theis et al. (1941) Thermal Maximum Water Table Temperatures and 1939 Artesian Head Map Highest 2013 Water Table Temperatures are spa>ally Associated with Deep 1939 Artesian Flow System Discharge Area. Is this a NW-­‐SE fault zone? Comparison of Spa Discharge Temperature Map, 2013 to Theis et al. (1941) Discharge Temperature Map Comparison of Geothermal Water Salinity 1939, 2013 ID Date Status TDS _mg/L TC-­‐010 10/19/2012 10/19/2012 10/19/2012 10/26/2012 10/26/2012 10/26/2012 1/9/2013 1/9/2013 Pump Open Pump Pump Open Open Pool Pool Mean: Pump Artesian Spring Spring mean: 3170 3170 3200 3009 2648 3184 3100 3087 TC-­‐011 TC-­‐012 TC-­‐017 TC-­‐020 TC-­‐026 TC-­‐069 TC-­‐070 19 27 22 23 2/9/1939_2/10/1939 2/9/1939_2/10/1939 2/9/1939_2/10/1939 2/9/1939_2/10/1939 2013 3071 2486 2437 2418 2560 Modern Geothermal Water is ~ 500 mg/l more saline Theis et al. (1941) 2475 14C Groundwater Residence Times 4000 Years 6,000 to 10,000 Years Spa District Wells A’ Cold wells South of Rio Grande Electrical Resis>vity Survey, March, 2013 A A Low Resis>vity Fluids = Saline, Geothermal Fluids ? Thermal Plume? A’ Cross-­‐Sec>onal Hydrothermal Model Sierra Cuchillo Engle Basin Two Scenarios: a) Distance Recharge from West-­‐Northwest, Deep Crystalline Basement Circula>on b) More Local Recharge from North, flow through Magdalena Limestone a) Cross-­‐Sec>onal Hydrothermal Model Sierra Cuchillo Engle Basin Two Scenarios: a) Distance Recharge from West-­‐Northwest, Deep Crystalline Basement Circula>on b) More Localized Recharge from Engle Basin, flow through Magdalena Limestone b) Cross-­‐Sec>onal Hydrothermal Model } Hydrologic Window Finite Element Grid s ozoic r Pale Lowe Cross-­‐Sec)onal Hydrothermal Model Results High Permeability (10-­‐13 m2 ) Crystalline Basement Scenario Cross-­‐Sec)onal Hydrothermal Model Results Low Permeability (10-­‐19 m2) Crystalline Basement Scenario s flow line Eleva>on (m) flow lines > 32,00 0 years > 32,000 years Distance (m) Distance (m) Cross-­‐Sec)onal Hydrothermal Model Results Spa District Temperatures High Permeability Crystalline Basement Low Permeability Crystalline Basement nes flow li } Hydrologic Window High Permeability Crystalline Basement Cross-­‐Sec>onal Hydrothermal Model Results Groundwater Residence Times (years) High Permeability Basement: Eleva>on (m) Spa District Age ~ 11,000 years Low Permeability Crystalline Basement 32,00 Low Permeability Basement: 0 > 32,000 years Distance (m) Spa District Age ~ 20,000 to 60,000 years Cross-­‐Sec>onal Hydrothermal Model Results Hydraulic Heads (m) Eleva>on (m) High Ver>cal Head Gradient: Δh/Δz ~ 0.4 Lower Ver>cal Head Gradient: Δh/Δz ~ 0.02 Distance (m) MODFLOW Model Analysis of Safe Aquifer Yield • • • • • • Three-­‐dimensional Analysis of Groundwater Flow Pa[erns Lateral Dimensions of grid ~ 20 km by 21 km Bounded to East and West by Mud Springs and TorC faults Grid Refinement in Spa District ( 20 m < Δx & Δy < 500m ) Groundwater flow Path line analysis to assessment recharge sources & groundwater-­‐surface water interac>ons Computed Hydraulic Heads for Regional Grid Spa District Grid Pumping Wells Path Line Analysis (blue lines) Computed Heads (m) High Pumping Rate Cone of depression forms in Spa District Some well water Derived from Rio Grande (bad) No Cone of depression forms in Spa District All well water Derived flow Up gradient in Watershed (good) Low Pumping Rate Findings • 14C Da>ng of Spa District Groundwaters Indicate Age Range between 6,000 to 10,000 Years before presents • Cross-­‐Sec>onal Hydrothermal Model Results Suggest deep circula>on within Crystalline Basement. The Spa District is Situated in a Hydrologic window due to Absence of Percha Shale. • 2013 & 1939 Water Table Contour Maps are similar in terms of eleva>on and pa[ern. No widespread cone of depression apparent in the 2013 data was found. We don’t have much informa>on on behavior of confined, “artesian” aquifer but it appears to have lost artesian condi>ons. • Geothermal Plume of Saline Water extends between 11-­‐22 m depth below land surface. The Plume appears to move laterally towards the Rio Grande • Temperature Maps of Theis et al. (1941) and 2013 are not well correlated. Highest 2013 Temperatures are to the East of 1939 Thermal Maximum • Average Total Dissolved Solids Concentra>on of Thermal Waters Increased from 2500 mg/l to 3100 mg/l between 1941 and 2013

