Normal Distribution: If data is NORMALLY DISTRIBUTED, then it... follows. This means, 34% of the data scores are...
advertisement
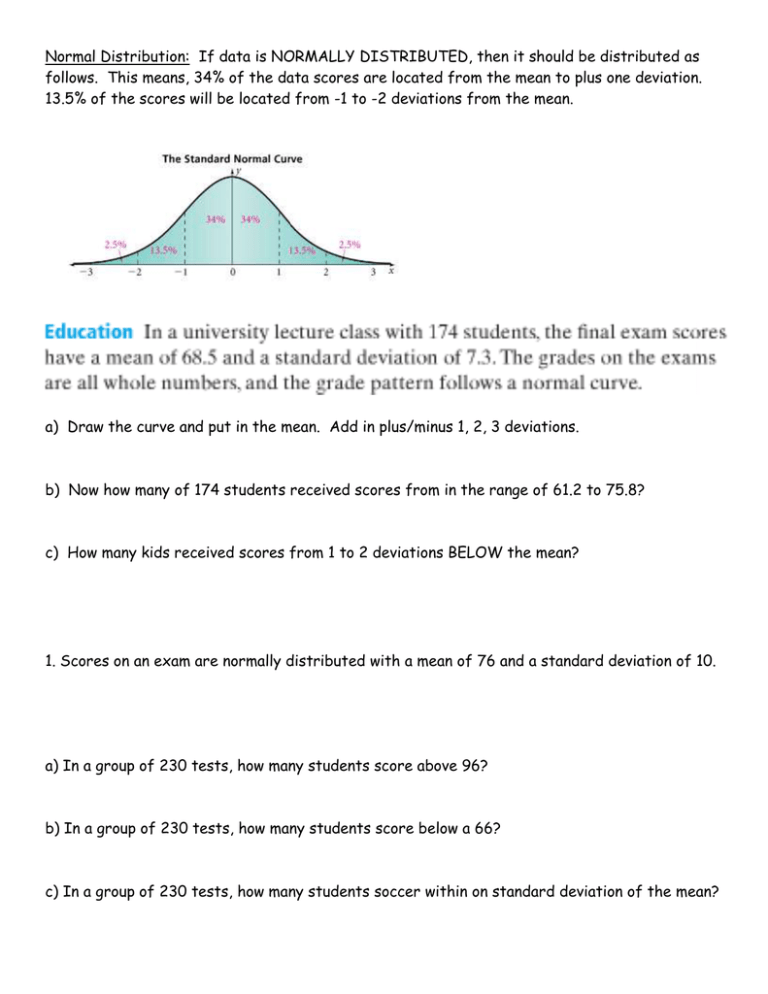
Normal Distribution: If data is NORMALLY DISTRIBUTED, then it should be distributed as follows. This means, 34% of the data scores are located from the mean to plus one deviation. 13.5% of the scores will be located from -1 to -2 deviations from the mean. a) Draw the curve and put in the mean. Add in plus/minus 1, 2, 3 deviations. b) Now how many of 174 students received scores from in the range of 61.2 to 75.8? c) How many kids received scores from 1 to 2 deviations BELOW the mean? 1. Scores on an exam are normally distributed with a mean of 76 and a standard deviation of 10. a) In a group of 230 tests, how many students score above 96? b) In a group of 230 tests, how many students score below a 66? c) In a group of 230 tests, how many students soccer within on standard deviation of the mean? 2. The number of nails of a given length is normally distributed with a mean length of 5.00 inches and a standard deviation of 0.03 inches. a) Find the number of nails in a bag of 120 that are less than 4.94 inches long. b) Find the number of nails in a bag of 120 that are between 4.97 and 5.03 inches long. c) Find the number of nails in a bag of 120 that are over 5.03 inches long. PG. 689 #15-17, #24 check answers. PG. 696 #27 Things to think about for notecard. -Binomial Thereom/Pascal’s triangle through 4 rows. -Binomial Experiments. nCr(success)n(failures)n-r -Definition of mutually exclusive. -Conditional Probability formula. P(B|A) = ? -Mean/Median/Mode -Box and Whisker -Standard deviation -Margin of Error -Normal Distribution. TEST FRIDAY!!!
