albedo of the planet and the atmospheric
advertisement
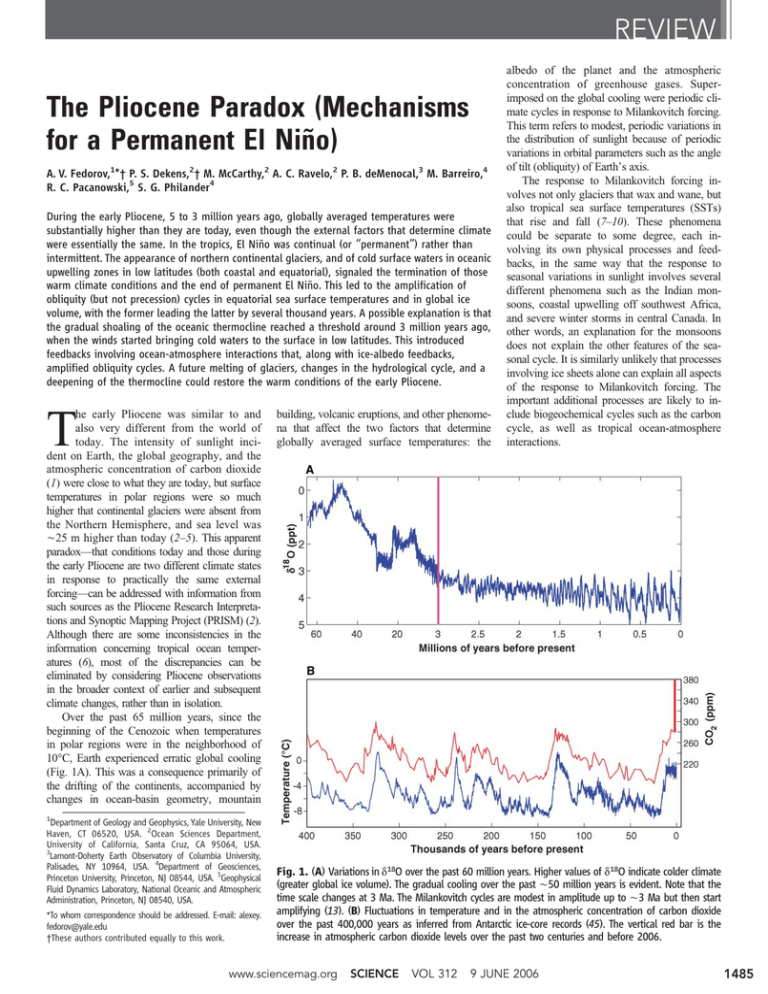
REVIEW The Pliocene Paradox (Mechanisms for a Permanent El Niño) A. V. Fedorov,1*† P. S. Dekens,2† M. McCarthy,2 A. C. Ravelo,2 P. B. deMenocal,3 M. Barreiro,4 R. C. Pacanowski,5 S. G. Philander4 During the early Pliocene, 5 to 3 million years ago, globally averaged temperatures were substantially higher than they are today, even though the external factors that determine climate were essentially the same. In the tropics, El Niño was continual (or ‘‘permanent’’) rather than intermittent. The appearance of northern continental glaciers, and of cold surface waters in oceanic upwelling zones in low latitudes (both coastal and equatorial), signaled the termination of those warm climate conditions and the end of permanent El Niño. This led to the amplification of obliquity (but not precession) cycles in equatorial sea surface temperatures and in global ice volume, with the former leading the latter by several thousand years. A possible explanation is that the gradual shoaling of the oceanic thermocline reached a threshold around 3 million years ago, when the winds started bringing cold waters to the surface in low latitudes. This introduced feedbacks involving ocean-atmosphere interactions that, along with ice-albedo feedbacks, amplified obliquity cycles. A future melting of glaciers, changes in the hydrological cycle, and a deepening of the thermocline could restore the warm conditions of the early Pliocene. he early Pliocene was similar to and also very different from the world of today. The intensity of sunlight incident on Earth, the global geography, and the atmospheric concentration of carbon dioxide (1) were close to what they are today, but surface temperatures in polar regions were so much higher that continental glaciers were absent from the Northern Hemisphere, and sea level was È25 m higher than today (2–5). This apparent paradox—that conditions today and those during the early Pliocene are two different climate states in response to practically the same external forcing—can be addressed with information from such sources as the Pliocene Research Interpretations and Synoptic Mapping Project (PRISM) (2). Although there are some inconsistencies in the information concerning tropical ocean temperatures (6), most of the discrepancies can be eliminated by considering Pliocene observations in the broader context of earlier and subsequent climate changes, rather than in isolation. Over the past 65 million years, since the beginning of the Cenozoic when temperatures in polar regions were in the neighborhood of 10-C, Earth experienced erratic global cooling (Fig. 1A). This was a consequence primarily of the drifting of the continents, accompanied by changes in ocean-basin geometry, mountain T 1 Department of Geology and Geophysics, Yale University, New Haven, CT 06520, USA. 2Ocean Sciences Department, University of California, Santa Cruz, CA 95064, USA. 3 Lamont-Doherty Earth Observatory of Columbia University, Palisades, NY 10964, USA. 4Department of Geosciences, Princeton University, Princeton, NJ 08544, USA. 5Geophysical Fluid Dynamics Laboratory, National Oceanic and Atmospheric Administration, Princeton, NJ 08540, USA. *To whom correspondence should be addressed. E-mail: alexey. fedorov@yale.edu †These authors contributed equally to this work. building, volcanic eruptions, and other phenomena that affect the two factors that determine globally averaged surface temperatures: the albedo of the planet and the atmospheric concentration of greenhouse gases. Superimposed on the global cooling were periodic climate cycles in response to Milankovitch forcing. This term refers to modest, periodic variations in the distribution of sunlight because of periodic variations in orbital parameters such as the angle of tilt (obliquity) of Earth_s axis. The response to Milankovitch forcing involves not only glaciers that wax and wane, but also tropical sea surface temperatures (SSTs) that rise and fall (7–10). These phenomena could be separate to some degree, each involving its own physical processes and feedbacks, in the same way that the response to seasonal variations in sunlight involves several different phenomena such as the Indian monsoons, coastal upwelling off southwest Africa, and severe winter storms in central Canada. In other words, an explanation for the monsoons does not explain the other features of the seasonal cycle. It is similarly unlikely that processes involving ice sheets alone can explain all aspects of the response to Milankovitch forcing. The important additional processes are likely to include biogeochemical cycles such as the carbon cycle, as well as tropical ocean-atmosphere interactions. Fig. 1. (A) Variations in d18O over the past 60 million years. Higher values of d18O indicate colder climate (greater global ice volume). The gradual cooling over the past È50 million years is evident. Note that the time scale changes at 3 Ma. The Milankovitch cycles are modest in amplitude up to È3 Ma but then start amplifying (13). (B) Fluctuations in temperature and in the atmospheric concentration of carbon dioxide over the past 400,000 years as inferred from Antarctic ice-core records (45). The vertical red bar is the increase in atmospheric carbon dioxide levels over the past two centuries and before 2006. www.sciencemag.org SCIENCE VOL 312 9 JUNE 2006 1485 REVIEW Although Milankovitch forcing has been relatively constant over the past several million years, the amplitude of the climatic response underwent remarkable changes as the long-term global cooling introduced different climate feedbacks. The Pliocene is of special interest because the feedbacks that came into play during that epoch, around 3 million years ago (Ma), started an amplification of the response of climate to orbital forcing. Over the past È1 million years, this process culminated in drastic oscillations between prolonged glaciations, or ice ages, and brief, warm interglacials (Fig. 1). During the warm interglacial periods—including the current one, which began some 10,000 years ago—conditions approach those of the early Pliocene. Will the present warm conditions terminate soon, to be followed by the next ice age? Or will the onset of the next ice age be inhibited by the current rise in the atmospheric concentration of greenhouse gases induced by humans (Fig. 1B)? Will that rise restore the warm conditions of the early Pliocene? Answers to these questions require identification of the processes that maintained warm conditions in the early Pliocene and then terminated them. Many studies focus on high-latitude processes associated with the appearance of northern continental ice sheets at È3 Ma. More recently, attention has turned to the tropics after the discovery that El NiDo was a continual (rather than intermittent) phenomenon up to È3 Ma (6, 11, 12). A Polar Perspective The global cooling that started around 50 Ma led to the appearance of large ice sheets, first on Antarctica around 35 Ma and subsequently on northern continents at È3 Ma (13). In sediments from a site in the North Pacific Ocean, ice-rafted debris appears abruptly at È2.7 Ma, indicating that the warm conditions of the early Pliocene had come to an end (14). Did this happen because of the increase in Earth’s albedo when Northern Hemisphere ice sheets appeared? This hypothesis has been tested with the use of general circulation models (GCMs) of the atmosphere. The results indicate that removal of the northern ice sheets increases temperatures only in the regions initially covered with ice (4). If, in addition, SSTs are specified to be high in high latitudes but unchanged in 1486 low latitudes, then the atmosphere is warmer over much larger regions, with some effects extending into the tropics (15). These results suggest that high SSTs in high latitudes, more than low albedo, helped maintain the warm conditions of the early Pliocene, but what processes maintained those high SSTs? One possibility is a larger poleward transport of heat by oceanic currents during the early Pliocene. Presumably the closure of the Panamanian Seaway in the early Pliocene reorganized the oceanic circulation and ultimately altered the poleward transport of heat. However, an open Panamanian Seaway could not explain the early Pliocene high-latitude warmth because the closure at the end of the warm period would have intensified the deep, thermohaline circulation in the Atlantic sector (16, 17), thus transporting more, not less, heat northward. It is conceivable that what mattered most was the northward transport not of heat, but of moisture that promoted the growth of the glaciers and hence a cooling trend (18). One problem with this argument is that the timing of the closure between 4.5 and 4.0 Ma (19) was much earlier than the onset of cold high-latitude conditions. Furthermore, this still leaves the warm conditions of the early Pliocene unexplained. Another puzzle concerns the amplification of the Milankovitch cycles that started around 3 Ma. At high latitudes, the appearance of northern glaciers at that time introduced icealbedo feedbacks that could have caused the amplification. Those feedbacks depend on variations in the intensity of solar radiation at high latitudes in summer (13). The precession of the equinox and changes in Earth’s obliquity make comparable contributions to high-latitude summer solar radiation. Why then, in the global ice volume records (Fig. 1), is the obliquity signal dominant over the precession signal (13)? Fig. 2. (A) Annual mean SST pattern (-C). The dots show approximate locations of the deep cores used to calculate the time series of SSTs displayed in Fig. 3. (B) Annual mean rainfall pattern (mm/day). Note the maximum in precipitation in the tropics associated with the ITCZ. (C) Annual mean heat flux (W/m2) into the ocean at low latitudes and out of the ocean at higher latitudes (46). The contour interval is 50 W/m2. Note a slightly different latitudinal extent of (C) as compared to (A) and (B). 9 JUNE 2006 VOL 312 SCIENCE www.sciencemag.org REVIEW 35 East equatorial Pacific (Mg/Ca) East equatorial Pacific (alkenones) SST (°C) West equatorial Pacific (Mg/Ca) 30 25 20 30 25 20 Peru margin (alkenones) California margin (alkenones) West African margin (alkenones) SST (°C) Variation in the equator-topole gradient of solar heating is dominantly controlled by obliquity. This gradient becomes a key parameter if the focus is not on the poleward transport of heat, which involves a negative feedback, but instead on the transport of moisture from low latitudes, which can amplify the waxing and waning of ice sheets (20). This argument brings conditions in the tropics into play but cannot explain recent findings that Milankovitch cycles of both ice volume and equatorial Pacific SSTs became amplified around 3 Ma. Obliquity stands out as the dominant signal, with the SST changes leading those in ice volume by several thousand years (7, 21). Even if ice-albedo feedbacks came into play before changes in ice volume, how could they have caused variations in the tropics? What are the tropical processes that could have contributed to climate variations associated with ice ages? 15 10 5 4 3 2 1 0 Age (Ma) Fig. 3. (Top) SST records in the western equatorial Pacific (red line, ODP site 806) and in the eastern equatorial Pacific (blue line, site 847), both based on Mg/Ca and adapted from (11), and that for the eastern Pacific based on alkenones (green dots, site 847) and adapted from (24). Larger circles are for the data based on Mg/Ca but from (44) for ODP sites 806 (red) and 847 (blue). Pink shading denotes the early Pliocene. For discussion, see (6). (Bottom) Alkenone-based SST records for the California margin (black, ODP site 1014) (24), the Peru margin (blue, site 1237) (24), and the West African margin (green, site 1084) (22). The locations of the ODP sites are shown in Fig. 2; for the exact geographical locations, see (47). Tropical Perspective Previous studies based on sparse data suggested that tropical and subtropical SSTs during the early Pliocene were essentially the same as those of today (2). Recent data from regions not covered by PRISM indicate otherwise. Apparently the salient features of SST patterns in low latitudes—the cold surface waters off the western coasts of Africa and the Americas (Fig. 2)—were absent until È3 Ma. This is evident in Fig. 3, which shows that up to È3 Ma, the SST difference between the eastern and western equatorial Pacific was very small, and cold surface waters were absent from the coastal upwelling zones off the western coasts of Africa and the Americas (11, 12, 22–24). Today, a large reduction in the east-west temperature gradient along the equator in the Pacific occurs only briefly during El Niño, which in effect was continual rather than intermittent up to 3 Ma. Corroborating evidence for a continual (or ‘‘permanent’’) El Niño is available in land records (25) that document the distinctive regional climate signatures associated with El Niño. Up to 3 Ma there was a persistence of mild winters in central Canada and the northeastern United States, droughts in Indonesia, and torrential rains along the coasts of California and Peru and in eastern equatorial Africa. The onset of dry conditions in the latter region around 3 Ma may have been important in the evolution of African hominids (26, 27). Persistent El Niño conditions would have had a huge impact on the global climate, given that today even brief El Niño episodes can have a large influence. The reasons are evident in Fig. 2, which shows a remarkably high correlation between tropical SSTs and rainfall patterns. Tall, rain-bearing, convective clouds cover the warmest waters, but highly reflective stratus decks that produce little rain cover the cold waters. During El Niño, the warming of the eastern equatorial Pacific reduces the area covered by stratus clouds, thus decreasing the albedo of the planet, while the atmospheric concentration of water vapor—a powerful greenhouse gas—increases. Calculations with a GCM of the atmosphere indicate that this happened during the early Pliocene and contributed significantly to the warm conditions at that time (28). The appearance of cold surface waters around 3 Ma in regions remote from each other (Figs. 2 and 3A) can be explained in terms of a global shoaling of the oceanic thermocline. [A contributing factor could have been the northward drift of Australia that restricted flow from the equatorial western Pacific into the Indian Ocean (29).] A shallower thermocline must involve changes in the oceanic heat budget shown in Fig. 2 (30, 31). In a state of equilibrium, the loss of heat in high latitudes—mainly where cold continental air masses flow over the warm Gulf Stream and Kuroshio Current in winter— balances the gain, mostly in low-latitude upwelling regions where cold water rises to the surface. www.sciencemag.org SCIENCE VOL 312 An increase in the loss of heat in high latitudes must be accompanied by an increase in the gain of heat, which requires a shallower equatorial thermocline (30). A decrease in the heat loss, and associated reduction in the poleward heat transport by the ocean, would imply a deeper equatorial thermocline. The oceanic heat transport is affected by the meridional overturning of the oceanic circulation. A freshening of the surface waters in the extratropics, which reduces the surface meridional density gradient between low and high latitudes, can reduce the heat transport. This is true for the deep, slow thermohaline component of the circulation whose changes affect mainly the climate of the northern Atlantic (32), as well as for the rapid, shallow wind-driven component whose changes affect mostly the tropics. Sufficiently large freshening in the extratropics can induce a perennial El Niño (33). Idealized calculations with an ocean GCM (Fig. 4) show that such a freshening can reduce the zonal SST gradient along the equator, reduce the poleward heat transport, and deepen the equatorial thermocline (33). As the freshwater flux increases from one experiment to the next, the different parameters are seen to change slowly at first and then to change rapidly as the flux approaches a critical value. When the freshwater forcing exceeds a threshold, the zonal SST gradient vanishes and permanently warm conditions prevail in the 9 JUNE 2006 1487 REVIEW tropics. Thus, these calculations represent one in phase with the extratropical forcing (7). The Pacific; it contributed to global warming by potential mechanism for maintaining a perma- precession of the equinox, by contrast, has too causing the absence of stratus clouds from the short a time scale for an adjustment in the eastern equatorial Pacific, thus lowering the nent El Niño. Our arguments suggest that, during (and oceanic heat budget to be possible. It induces planetary albedo, and by increasing the atmoprobably before) the early Pliocene, when El seasonal changes in sunlight but has no effect spheric concentration of water vapor, a powerNiño was continual, oceanic heat gain at low on the annually averaged sunlight. These argu- ful greenhouse gas. Today the atmospheric latitudes and heat loss at high latitudes were ments explain why tropical Pacific temperature concentration of another greenhouse gas, carminimal, and the thermocline was deep. The records are dominated by obliquity variations bon dioxide, is comparable to what it was in the theory that the gradual global cooling during and are nearly in phase with high-latitude rather early Pliocene, but the climate of the planet is much of the Cenozoic (Fig. 1) and the as- than local solar variations (21, 31), and why not yet in equilibrium with those high values. It is possible that a persistence of high sociated decrease in the temperacarbon dioxide concentrations could ture of the deep ocean (34) caused result in a return to a globally warm the thermocline to shoal has corworld if it were to increase temperroborating evidence (11). A threshatures and precipitation in high latold was reached around 3 Ma itudes, and as a consequence cause when the thermocline became so the tropical thermocline to deepen by shallow that the winds could bring a modest amount, a few tens of cold waters to the surface in the meters. (Near the date line at the various upwelling zones (31). With equator, the thermocline is already so the transition to this colder climate, deep that its vertical excursions leave the mean SSTs in the eastern surface temperatures unaffected.) equatorial Pacific should have beA deepening of the tropical come asymmetric with respect to thermocline requires a reduction in the equator, possibly resembling the oceanic heat loss in the extrathe present-day structure in which tropics (30). However, in certain warmer water and the Intertropical atmospheric models, warm condiConvergence Zone (ITCZ) stay tions in high latitudes depend on the north of the equator while colder atmosphere gaining heat from the water stays south of it (Fig. 2B). oceans (36). This is also the case in The appearance of cold surface the coupled ocean-atmosphere cliwaters in the equatorial upwelling mate model that was recently used zones introduced feedbacks that to simulate the early Pliocene (37). affected the response of tropical In that model, the oceanic heat loss SSTs to Milankovitch forcing. The in the extratropics is balanced by winds influence SSTs and also the gain of heat in the eastern depend on those temperatures beequatorial Pacific. This gain is cause they blow from the cold possible despite higher SSTs in toward the warm regions along the low latitudes because temperature equator where the Coriolis force gradients along the equator, and vanishes. This circular argument presumably the depth of the equaimplies a positive feedback between torial thermocline, do not change the ocean and the atmosphere first significantly. This means that, in the described by Jacob Bjerknes (35). model, maximum SSTs in the west(Another positive feedback involves ern tropical Pacific rise significantly low stratus clouds.) In the case of above 30-C. This is inconsistent El Niño, the SST-wind feedback with observations indicating that at depends on an adiabatic redisno time in the past 10 million years tribution of warm surface waters were SSTs much higher than 30-C. (Fig. 5A). On much longer time Are the models at fault, or is there a scales it involves diabatic, vertical problem with the observations? movements of the thermocline More data from the western (Fig. 5B) and influences the cli- Fig. 4. Changes in the zonal SST gradient along the equator (top), the matic response to obliquity var- poleward heat transport across a fixed latitude (middle), and the equatorial tropical Pacific (and also from iations (31). During times when thermocline depth (bottom) in an idealized ocean GCM as the flux of fresh currently warm regions to the west obliquity and solar heating in high water onto the surface near the northern boundary of the basin increases. of upwelling zones) are needed to latitudes have maxima, reduced Blue dots correspond to the conditions of today; red dots indicate the determine the maximum temperatures over the last millions of oceanic heat loss to the atmosphere equatorial thermocline collapse (33). years, and to determine whether can induce a deepening of the equatorial thermocline and a tendency toward El they become amplified over the long term (7) observations of perennial El Niño are robust. If Niño conditions. This is possible only on time when the thermocline shoals (11) and air-sea the information available at present should prove accurate, then temperatures in excess of scales sufficiently long for the tropical oceans to feedbacks are strengthened. 30-C in some models, and problems in their adjust to changes in higher latitudes. ability to simulate a perennial El Niño, could be Obliquity causes annually averaged sunlight Discussion to vary for such prolonged periods (thousands A major factor in the warmth of the early indicative of flaws in the models—for example, of years) that the tropical response is practically Pliocene was the persistence of El Niño in the in the parameterization of clouds. Models are 1488 9 JUNE 2006 VOL 312 SCIENCE www.sciencemag.org REVIEW Depth A West East Depth B specifically 80 K and 120 K (38). Apparently obliquity continued to play a dominant role, up to the present, in pacing glacial terminations and also in equatorial Pacific variables (21, 39). To determine the relative importance of feedbacks involving ice albedo, tropical ocean-atmosphere interactions, and biogeochemical cycles, it will be valuable to have a detailed description of the obliquity signal over the past several million years, inferred from a synthesis of the diverse measurements (productivity, SST, thermocline depth, ice volume, atmospheric gas concentration, etc.). Explaining the remarkable changes in the climate response to solar forcing that itself did not change significantly is a major challenge for both paleoclimatologists and climate modelers. References and Notes West East Longitude Fig. 5. A sketch of the change (from solid to dashed line) in the thermocline along the equator for (A) an adiabatic, horizontal redistribution of warm water that characterizes the interannual oscillations between El Niño and La Niña, and (B) a slow diabatic increase in the volume of warm water that can lead to a perennial El Niño. An increase in obliquity will correspond to a combination of (B) and (A) because tropical ocean-atmosphere interactions will modify the slope of the thermocline as well. At present, the mean thermocline depth in the equatorial Pacific is È120 m. designed to reproduce the world of today, but it is unclear how much confidence we should have in simulations of very different climates. Efforts to predict future global warming could benefit enormously from a better understanding of past climates, especially of the Milankovitch cycles for which the forcing functions are known precisely. The obliquity cycles are of special interest because they started increasing in amplitude around 3 Ma and then changed character again around 1 Ma. Initially, it was thought that the latter change involved a shift of the dominant period from 40 K to 100 K (13). However, recent analyses indicate that the shift could have been from 40 K to multiples of 40 K, 1. Estimates of the concentration of carbon dioxide in the atmosphere during the early Pliocene range from 340 to 380 ppm (5, 40) to 280 to 300 ppm (41). Today the concentration has been in excess of 330 ppm for only a few decades, and has been elevated above 280 ppm for only 2000 to 3000 years (42). 2. H. J. Dowsett, J. Barron, R. Poore, Mar. Micropaleontol. 27, 13 (1996). 3. H. J. Dowsett, M. A. Chandler, T. M. Cronin, G. S. Dwyer, Paleoceanography 20, 10.1029/2005PA001133 (2005). 4. T. Crowley, Mar. Micropaleontol. 27, 3 (1996). 5. M. E. Raymo, B. Grant, M. Horowitz, G. H. Rau, Mar. Micropaleontol. 27, 313 (1996). 6. Geochemical and faunal-based estimates of SST in the equatorial Pacific over the past 5 million years are in basic agreement with each other, as is evident in Fig. 3 (11, 12, 23, 24), and with the d18O record from planktonic foraminifers (12, 31, 43). The recent contradictory finding that the eastern tropical Pacific was relatively cool in the early Pliocene (44) is based on two questionable data points, one of which is shown in Fig. 3 (the large blue circle at È4.1 Ma) and the other one lying outside the time range of this figure. For further discussion, see (43). Higher resolution time series of tropical SSTs that resolve Milankovitch cycles are now also available (7–10). 7. K. Lawrence, Z. Liu, T. Herbert, Science 312, 79 (2006). 8. D. W. Lea, D. K. Pak, H. J. Spero, Science 289, 1719 (2000). 9. M. Medina-Elizalde, D. W. Lea, Science 310, 1009 (2005); published online 13 October 2005 (10.1126/ science.1115933). 10. T. de-Garidel-Thoron, Y. Rosenthal, F. Bassinot, L. Beaufort, Nature 433, 294 (2005). 11. M. Wara, A. C. Ravelo, M. L. Delaney, Science 309, 758 (2005); published online 23 June 2005 (10.1126/ science.1112596). 12. A. C. Ravelo, D. H. Andreason, M. Lyle, A. O. Lyle, M. Wara, Nature 429, 263 (2004). 13. J. Zachos, M. Pagani, L. Sloan, E. Thomas, K. Billups, Science 292, 686 (2001). 14. G. H. Haug, D. M. Sigman, R. Tiedemann, T. F. Pedersens, M. Sarnthein, Nature 401, 779 (1999). 15. L. C. Sloan, T. J. Crowley, D. Pollard, Mar. Micropaleontol. 27, 51 (1996). www.sciencemag.org SCIENCE VOL 312 16. G. H. Haug, R. Tiedemann, Nature 393, 673 (1998). 17. A. Klocker, M. Prange, M. Schulz, Geophys. Res. Lett. 32, 10.1029/2004GL021564 (2005). 18. N. W. Driscoll, G. H. Haug, Science 282, 436 (1998). 19. G. H. Haug, R. Tiedemann, R. Zahn, A. C. Ravelo, Geology 29, 207 (2001). 20. M. E. Raymo, K. Nisancioglu, Paleoceanography 18, 10.1029/2002PA000791 (2003). 21. Z. Liu, T. Herbert, Nature 427, 720 (2004). 22. J. R. Marlow, C. B. Lange, G. Wefer, A. Rosell-Melé, Science 290, 2288 (2000). 23. A. M. Haywood, P. Dekens, A. C. Ravelo, M. Williams, Geochem. Geophys. Geosyst. 6, 10.1029/2004GC000799 (2005). 24. P. S. Dekens, A. C. Ravelo, M. McCarthy, in preparation. 25. P. Molnar, M. Cane, Paleoceanography 17, 10.1029/ 2001PA000663 (2002). 26. P. B. deMenocal, Science 270, 53 (1995). 27. S. J. Feakins, P. B. deMenocal, T. I. Eglinton, Geology 33, 977 (2005). 28. M. Barreiro, S. G. Philander, R. C. Pacanowski, A. V. Fedorov, Clim. Dyn., 10.1007/s00382-005-0086-4 (2006). 29. M. Cane, P. Molnar, Nature 411, 157 (2001). 30. G. Boccaletti, R. Pacanowski, S. G. Philander, A. V. Fedorov, J. Phys. Oceanogr. 34, 888 (2004). 31. S. G. Philander, A. V. Fedorov, Paleoceanography 18, 1045 (2003). 32. S. Manabe, R. J. Stouffer, Nature 378, 165 (1995). 33. A. V. Fedorov, R. C. Pacanowski, S. G. Philander, G. Boccaletti, J. Phys. Oceanogr. 34, 1949 (2004). 34. C. H. Lear, H. Elderfield, P. A. Wilson, Science 287, 269 (2000). 35. H. A. Dijkstra, J. D. Neelin, J. Clim. 12, 1630 (1999). 36. M. Winton, J. Clim. 16, 2875 (2003). 37. A. M. Haywood, P. J. Valdes, Earth Planet. Sci. Lett. 218, 363 (2004). 38. P. Huybers, C. Wunsch, Nature 434, 491 (2005). 39. L. Beaufort, T. de Garidel-Thoron, A. C. Mix, N. G. Pisias, Science 293, 2440 (2001). 40. J. Van Der Burgh, H. Visscher, D. L. Dilcher, V. M. Kürschner, Science 260, 1788 (1993). 41. M. Pagani, K. H. Freeman, M. A. Arthur, Science 285, 876 (1999). 42. A. Indermühle et al., Nature 398, 121 (1999). 43. A. C. Ravelo, P. S. Dekens, M. McCarthy, GSA Today 3, 10.1130/1052-5173 (2006). 44. R. E. M. Rickaby, P. Halloran, Science 307, 1948 (2005). 45. J. R. Petit et al., Nature 399, 429 (1999). 46. A. Da Silva, A. C. Young-Molling, S. Levitus, Atlas of Surface Marine Data (NOAA, Silver Spring, MD, 1994), vol. 6. 47. Locations and depths of the Ocean Drilling Program (ODP) sites used for Fig. 3: ODP site 806 (0-N, 159-E, 2520 m); ODP site 847 (0-N, 95-W, 3373 m); ODP site 1014 (33-N, 120-W, 1165 m); ODP site 1237 (16-S, 76-W, 3212 m); ODP site 1084 (26-S, 13-E, 1192 m). 48. Supported in part by NSF grants OCE-0550439 (A.V.F.) and OCE-081697 and ATM-0222383 (A.C.R.), U.S. Department of Energy Office of Science grant DE-FG0206ER64238 (A.V.F.), NOAA grant NA16GP2246 (S.G.P.), and Yale University. We thank two anonymous reviewers and T. Herbert, K. Lawrence, P. Huybers, Z. Liu, D. Sigman, J. Severinghaus, and M. Bender for fruitful discussions. 10.1126/science.1122666 9 JUNE 2006 1489
