Running a Regression on a Graphing Calculator
advertisement

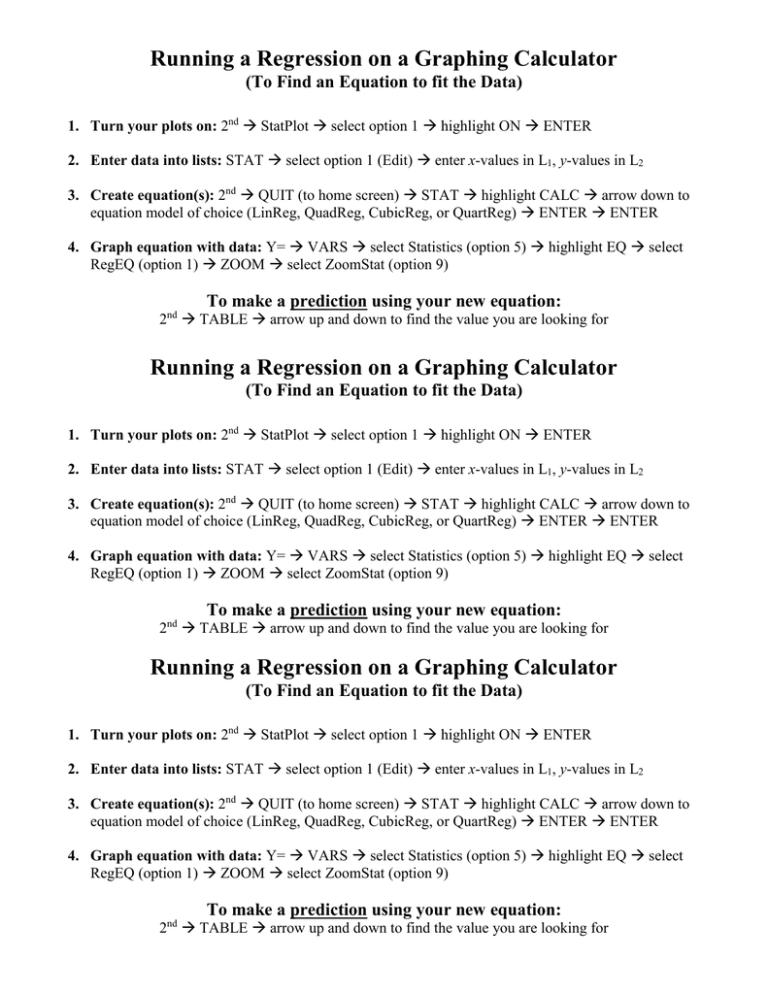
Running a Regression on a Graphing Calculator (To Find an Equation to fit the Data) 1. Turn your plots on: 2nd StatPlot select option 1 highlight ON ENTER 2. Enter data into lists: STAT select option 1 (Edit) enter x-values in L1, y-values in L2 3. Create equation(s): 2nd QUIT (to home screen) STAT highlight CALC arrow down to equation model of choice (LinReg, QuadReg, CubicReg, or QuartReg) ENTER ENTER 4. Graph equation with data: Y= VARS select Statistics (option 5) highlight EQ select RegEQ (option 1) ZOOM select ZoomStat (option 9) To make a prediction using your new equation: 2nd TABLE arrow up and down to find the value you are looking for Running a Regression on a Graphing Calculator (To Find an Equation to fit the Data) 1. Turn your plots on: 2nd StatPlot select option 1 highlight ON ENTER 2. Enter data into lists: STAT select option 1 (Edit) enter x-values in L1, y-values in L2 3. Create equation(s): 2nd QUIT (to home screen) STAT highlight CALC arrow down to equation model of choice (LinReg, QuadReg, CubicReg, or QuartReg) ENTER ENTER 4. Graph equation with data: Y= VARS select Statistics (option 5) highlight EQ select RegEQ (option 1) ZOOM select ZoomStat (option 9) To make a prediction using your new equation: 2 TABLE arrow up and down to find the value you are looking for nd Running a Regression on a Graphing Calculator (To Find an Equation to fit the Data) 1. Turn your plots on: 2nd StatPlot select option 1 highlight ON ENTER 2. Enter data into lists: STAT select option 1 (Edit) enter x-values in L1, y-values in L2 3. Create equation(s): 2nd QUIT (to home screen) STAT highlight CALC arrow down to equation model of choice (LinReg, QuadReg, CubicReg, or QuartReg) ENTER ENTER 4. Graph equation with data: Y= VARS select Statistics (option 5) highlight EQ select RegEQ (option 1) ZOOM select ZoomStat (option 9) To make a prediction using your new equation: 2nd TABLE arrow up and down to find the value you are looking for


