Housing Prices, Turnover and Borrowing Box A
advertisement
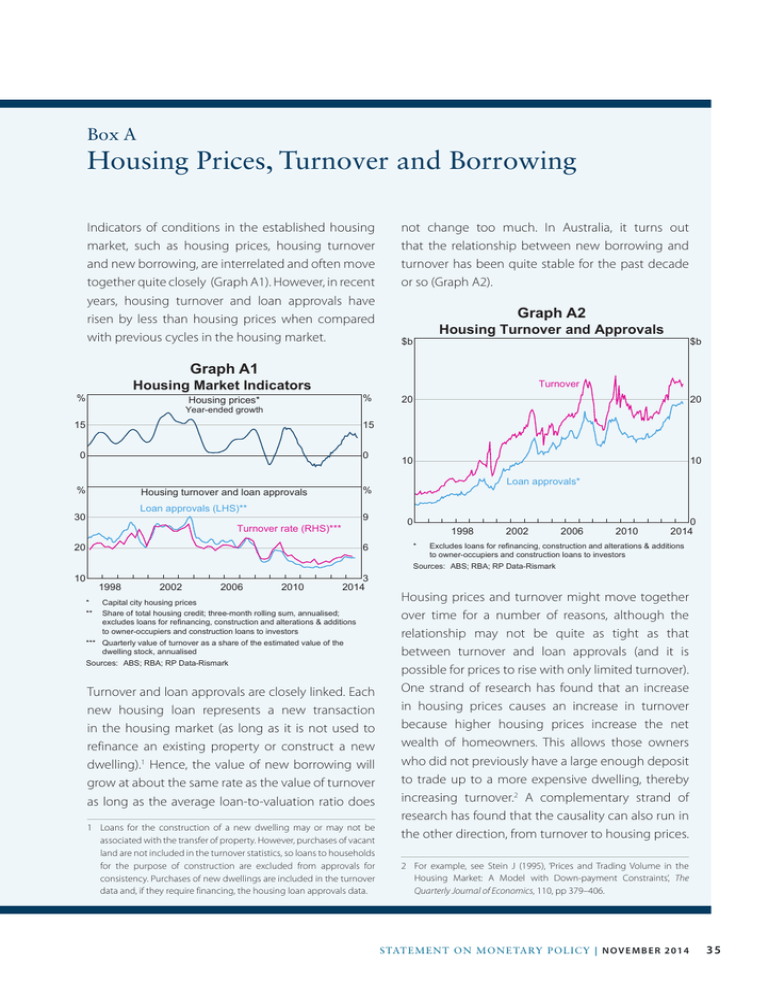
Box A Housing Prices, Turnover and Borrowing Indicators of conditions in the established housing market, such as housing prices, housing turnover and new borrowing, are interrelated and often move together quite closely (Graph A1). However, in recent years, housing turnover and loan approvals have risen by less than housing prices when compared with previous cycles in the housing market. not change too much. In Australia, it turns out that the relationship between new borrowing and turnover has been quite stable for the past decade or so (Graph A2). Graph A2 Housing Turnover and Approvals $b Graph A1 Housing Market Indicators % Turnover % Housing prices* Year-ended growth 15 15 0 0 % Loan approvals (LHS)** 9 Turnover rate (RHS)*** 20 6 10 1998 2002 2006 2010 20 20 10 10 Loan approvals* % Housing turnover and loan approvals 30 $b 3 2014 * Capital city housing prices ** Share of total housing credit; three-month rolling sum, annualised; excludes loans for refinancing, construction and alterations & additions to owner-occupiers and construction loans to investors *** Quarterly value of turnover as a share of the estimated value of the dwelling stock, annualised Sources: ABS; RBA; RP Data-Rismark Turnover and loan approvals are closely linked. Each new housing loan represents a new transaction in the housing market (as long as it is not used to refinance an existing property or construct a new dwelling).1 Hence, the value of new borrowing will grow at about the same rate as the value of turnover as long as the average loan-to-valuation ratio does 1 Loans for the construction of a new dwelling may or may not be associated with the transfer of property. However, purchases of vacant land are not included in the turnover statistics, so loans to households for the purpose of construction are excluded from approvals for consistency. Purchases of new dwellings are included in the turnover data and, if they require financing, the housing loan approvals data. 0 1998 2002 2006 2010 0 2014 * Excludes loans for refinancing, construction and alterations & additions to owner-occupiers and construction loans to investors Sources: ABS; RBA; RP Data-Rismark Housing prices and turnover might move together over time for a number of reasons, although the relationship may not be quite as tight as that between turnover and loan approvals (and it is possible for prices to rise with only limited turnover). One strand of research has found that an increase in housing prices causes an increase in turnover because higher housing prices increase the net wealth of homeowners. This allows those owners who did not previously have a large enough deposit to trade up to a more expensive dwelling, thereby increasing turnover.2 A complementary strand of research has found that the causality can also run in the other direction, from turnover to housing prices. 2 For example, see Stein J (1995), ‘Prices and Trading Volume in the Housing Market: A Model with Down-payment Constraints’, The Quarterly Journal of Economics, 110, pp 379–406. S TATE ME N T O N MO N E TARY P O L ICY | N O V E M B E R 2 0 1 4 35 It suggests that some vendors might discern a rise in housing demand by observing a rise in turnover, thereby encouraging them to raise their reserve prices.3 Turnover and housing price growth have moved together over time, although the relationship appears to have weakened somewhat in recent years. The change is most evident in Sydney and Melbourne, where growth in housing prices has been strongest of late (Graph A3). The rate of turnover has remained low in those cities, both in terms of their longer-term averages and relative to growth in housing prices.4 It is difficult to know why the turnover rate has remained relatively low compared with its history and compared with prices. There is tentative evidence to suggest that existing homeowners have become more reluctant to borrow against increases in their net wealth to trade up homes. For example, the survey of Household Income and Labour Dynamics in Australia (HILDA) suggests that in 2011 and 2012 (the two most recent survey years) a smaller share of households bought larger homes than in any of the previous nine survey years. Also, there has been unusually low participation of owner-occupiers in housing market transactions recently (Graph A4). The reasons are not clear, although it partly reflects the fact that state government incentives for first home buyers have been redirected away from established dwellings towards new dwellings. One possibility is that a reluctance to trade up homes reflects households generally becoming less willing to take on additional debt in recent years.5 Following the increase in leverage over the 1990s and early 3 See Wheaton W (1990), ‘Vacancy, Search, and Prices in a Housing Market Matching Model’, Journal of Political Economy, 98, pp 1270–1292. 4 It is important to note that the period of comparison (from the mid 1990s onwards) may not be a good indication of the usual relationship between turnover and credit, given that the sharp rise in housing prices and credit growth from the mid 1990s was the result of a number of other factors, including financial deregulation and the move to a low-inflation environment. 5 For further details, see Stevens G (2012), ‘The Cautious Consumer’, Address to The Anika Foundation Luncheon, July. 36 R es erv e Ba nk of Aus t r a l i a Graph A3 Housing Prices and Turnover Quarterly % % Sydney 5 9 Price growth** (LHS) 0 6 Turnover rate* (RHS) % % Melbourne 5 9 0 6 -5 1994 * ** 1998 2002 2006 2010 3 2014 Number of transactions as a share of the number of dwellings, annualised Median dwelling price, smoothed using five-quarter Henderson trend Sources: ABS; Australian Property Monitors; RBA; RP Data-Rismark Graph A4 Housing Loan Approvals and Repayments % % Housing loan approvals* – New South Wales Share of total 75 75 50 50 25 25 Investors % % Housing loan approvals* – Victoria Share of total 75 75 Owner-occupiers 50 50 25 25 % % Repayments on new housing loans** Share of labour income 60 60 New South Wales 40 Victoria Other*** 20 40 20 0 1994 1998 2002 2006 2010 0 2014 * Gross of refinancing ** Assumes a 20 per cent deposit on a median-priced dwelling, 25-year mortgage and constant repayments, and a 10-year fixed mortgage rate; labour income measured as compensation of employees per wage and salary earner *** Queensland, South Australia and Western Australia weighted together by the number of wage and salary earners Sources: ABS; Australian Property Monitors; RBA 2000s, the debt-to-income ratio has been stable at high levels. Although interest rates are currently low, the expected repayment burden on loans is at 10‑year average levels, when calculated using a longerterm interest rate to account for the expectation that variable interest rates will move up over time. Indeed, in New South Wales and Victoria, which have experienced the greatest disparity between housing prices and turnover relative to historical norms, the share of current income required to service an average loan over the next 10 years is close to historical highs. Another consideration is that homeowners may be less willing to borrow more because growth in labour income has slowed. Nominal labour income has grown at an average annual rate of 2.7 per cent over the past two years, compared with a decade average of 6.2 per cent. And the widespread expectation is that wage growth will remain subdued for a time. Moreover, the Westpac-Melbourne Institute survey suggests that the share of households expecting more unemployment a year ahead has been at above-average levels since late 2011, which is an unusually long time by the historical standards of the survey. Repayment obligations, in combination with uncertainty about future labour income, are an important consideration for homeowners. According to liaison with banks, one consequence of this environment is that an increasing share of owneroccupiers is opting for interest-only loans to increase repayment flexibility. A reluctance to trade up homes might also stem from increases in effective stamp duty rates. In some states, including New South Wales and Victoria, the nominal housing price thresholds at which higher rates of stamp duty apply have not changed for a number of years. As housing prices have risen, more buyers have fallen into the higher stamp duty brackets, acting as a disincentive to purchase housing. In New South Wales, for instance, the stamp duty paid on a median-priced home has grown to around 25 per cent of annual disposable income per household, from close to 10 per cent in 1991. Finally, the relationship between turnover and housing prices can be affected by developments in housing supply. Additions to the housing stock have been relatively low in some states over recent years, which would weigh on the rate of turnover as it is currently measured, while low supply relative to demand would also put upward pressure on prices. R S TATE ME N T O N MO N E TARY P O L ICY | N O V E M B E R 2 0 1 4 37 38 R es erv e Ba nk of Aus t r a l i a

