International Economic Developments 1.
advertisement
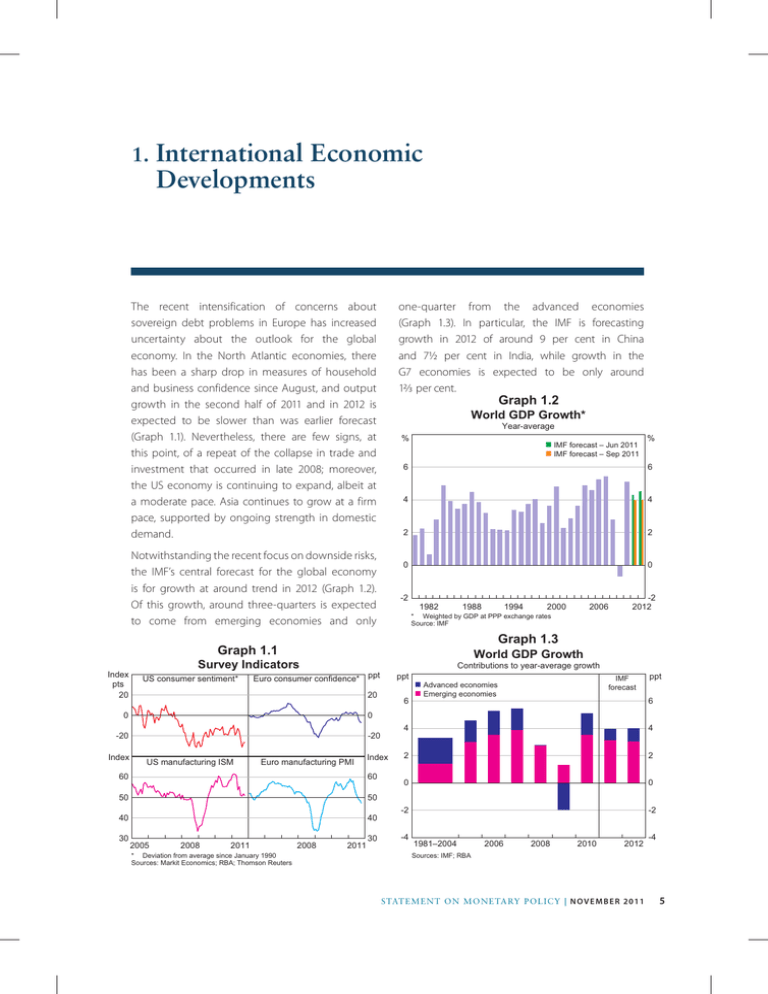
International Economic Developments 1. The recent intensification of concerns about sovereign debt problems in Europe has increased uncertainty about the outlook for the global economy. In the North Atlantic economies, there has been a sharp drop in measures of household and business confidence since August, and output growth in the second half of 2011 and in 2012 is expected to be slower than was earlier forecast (Graph 1.1). Nevertheless, there are few signs, at this point, of a repeat of the collapse in trade and investment that occurred in late 2008; moreover, the US economy is continuing to expand, albeit at a moderate pace. Asia continues to grow at a firm pace, supported by ongoing strength in domestic demand. one-quarter from the advanced economies (Graph 1.3). In particular, the IMF is forecasting growth in 2012 of around 9 per cent in China and 7½ per cent in India, while growth in the G7 economies is expected to be only around 12/3 per cent. Graph 1.2 World GDP Growth* Year-average % Notwithstanding the recent focus on downside risks, the IMF’s central forecast for the global economy is for growth at around trend in 2012 (Graph 1.2). Of this growth, around three-quarters is expected to come from emerging economies and only n IMF forecast – Jun 2011 n IMF forecast – Sep 2011 6 6 4 4 2 2 0 0 -2 1982 1988 -2 2012 Contributions to year-average growth Euro consumer confidence* ppt ppt 20 6 IMF forecast n Advanced economies n Emerging economies ppt 6 0 -20 -20 US manufacturing ISM Euro manufacturing PMI Index 60 60 50 50 40 40 30 2006 Graph 1.3 0 Index 2000 World GDP Growth Survey Indicators US consumer sentiment* 1994 * Weighted by GDP at PPP exchange rates Source: IMF Graph 1.1 Index pts 20 % 2005 2008 2011 * Deviation from average since January 1990 Sources: Markit Economics; RBA; Thomson Reuters 2008 2011 30 4 4 2 2 0 0 -2 -2 -4 1981–2004 2006 2008 2010 2012 -4 Sources: IMF; RBA STATE ME N T O N MO N E TARY P O L ICY | N O V E M B E R 2 0 1 1 5 Asia In China, the economy continues to expand at a firm pace, although recently the pace of growth has moderated a little. GDP is estimated to have increased by 2.3 per cent in the September quarter to be 9.1 per cent higher over the year, compared with growth of just under 10 per cent over 2010 (Graph 1.4). Some slowing in growth has been desired by the Chinese authorities to curb inflationary pressures and reflects, to some extent, tighter financial policy and the unwinding of earlier fiscal stimulus. Graph 1.4 China – GDP Growth % % Year-ended 12 12 8 8 Quarterly* 4 0 4 2001 2003 2005 2007 2009 2011 0 * RBA estimates prior to December quarter 2010 Sources: CEIC; RBA Graph 1.5 China – Indicators of Demand % Fixed asset investment* ’000 Automobile sales 30 2 000 1 500 20 Year-ended Total 1 000 10 500 0 Monthly -10 2005 2008 Passenger vehicles 2011 * 2008 2011 0 Year-ended growth rates, and monthly growth rates prior to February 2011, are RBA estimates Sources: CEIC; RBA 6 R ES ERV E B A N K O F AUS T RA L I A Growth in domestic demand remains strong, although it has eased from its earlier rapid pace. The withdrawal of fiscal stimulus has resulted in a significant slowing in infrastructure investment, while growth in both manufacturing and real estate investment has moderated from earlier in the year (Graph 1.5). Administrative measures have slowed the growth in turnover in the residential property market and have reduced property price inflation, with prices falling modestly in some cities. In contrast, automobile production and sales have increased strongly in recent months, returning to the levels recorded in late 2010, before the stimulus measures aimed at boosting passenger vehicle sales expired. Measures of activity also suggest that growth in overall industrial production and nominal retail sales continued at a solid pace. Furthermore, there has been strong growth in purchases of household appliances in rural areas, with government subsidies providing ongoing support to rural consumption. There are some signs that the weaker external economic conditions, particularly in the North Atlantic economies, are having an effect on Chinese exports, both directly and indirectly through supply chains in east Asia. While the value of Chinese exports to the North Atlantic has been broadly flat over the past six months, exports to east Asia (excluding Japan) peaked earlier in the year and have since contracted. Imports of goods for processing and assembly are also little changed since the beginning of the year, in part reflecting the moderation of east Asian exports of electronics to major developed economies. Nevertheless, imports of commodities remain at a high level. Tighter financial conditions in China are having a significant effect on some parts of the economy, although the impact on other sectors is relatively limited. Growth in aggregate credit has slowed to around 16 per cent and the share of loans being charged interest rates above the relevant benchmark rate has increased to the highest level in six years (Graph 1.6). Some firms, including in the real estate sector, are reporting that the availability of credit has become as difficult as it was in mid to late 2008, prior to the monetary stimulus. However, enterprises engaged in the development of low-cost housing have been able to borrow more easily. There have also been reports that small- and medium-sized enterprises (SME) have had particular difficulty in accessing credit, which has resulted in the Chinese Government recently announcing measures to encourage lending to SMEs and reduce their tax burden. Headline inflation appears to have peaked in China, due mainly to a moderation in food price inflation; after reaching 6.5 per cent in July, yearended inflation eased to 6.1 per cent in September (Graph 1.7). Pork prices, which were a major contributing factor to the pick-up in inflation during late 2010 and early 2011, have fallen from their recent peaks. Excluding food, inflation looks to have stabilised at around 3 per cent in recent months, with much of the increase in earlier months reflecting second-round effects of increases in commodity prices. Clothing prices have recorded their highest rate of inflation in a decade, and earlier increases in agricultural prices have contributed to a pick-up in inflation for tobacco and liquor prices, while furniture prices are also increasing at a relatively rapid pace. Although inflationary pressures remain firm in China, the modest slowing in domestic demand and the fall in commodity prices over recent months are both likely to contribute to lower inflation outcomes over the period ahead. Inflation in India also remains high, although recently there has been some slowing in nonfood manufacturing inflation (a measure of ‘core inflation’). This moderation can be expected to continue as lower commodity prices begin to flow through into other prices. In response to high rates of inflation over recent months, the Reserve Bank of India increased its repo rate by 25 basis points in both September and October to bring the cumulative increase in interest rates since early 2010 to 375 basis points. Graph 1.6 China – Credit Conditions % Share of loans with interest rate above benchmark % 60 60 50 50 40 40 ppt ppt Access to credit* 40 40 35 35 30 2005 2006 2007 2008 2009 2010 2011 30 * Share of firms reporting relatively easy access to credit less the share of firms reporting relatively tight access to credit Sources: CEIC; The People’s Bank of China Graph 1.7 China – Consumer Price Inflation Year-ended % % 20 20 Food 15 15 10 10 CPI 5 5 0 0 Non-food -5 2005 2006 2007 2008 2009 2010 2011 -5 Source: CEIC Some slowing in growth in the Indian economy is likely from the 7½–8 per cent pace expected for 2011. Growth in agricultural output is expected to ease, although the level of production will remain high following two consecutive years of around average summer rainfall. Growth in industrial production has slowed noticeably this year and, excluding capital goods, production is estimated to have contracted by 3 per cent between March and August (Graph 1.8). Recent data published by the Reserve Bank of India indicate that services exports grew strongly in the September quarter, suggesting that conditions in India’s largest sector remain favourable, although the services PMI has fallen in recent months. STATE ME N T O N MO N E TARY P O L ICY | N O V E M B E R 2 0 1 1 7 Graph 1.8 India – Economic Indicators % Wholesale price inflation GDP growth Year-ended % Year-ended 10 10 Quarterly 5 % 0 Industrial production growth Index Services PMI Year-ended 15 60 0 50 -15 2007 2009 2011 2007 2009 2011 40 Sources: CEIC; Markit Economics; RBA Graph 1.9 East Asia* – Production and Exports 2003 average = 100 Index Index Export volumes Industrial production 160 190 140 160 120 130 100 100 80 2003 2007 2011 2007 70 2011 * Excluding China and Japan; Hong Kong and Indonesia also excluded from industrial production Sources: CEIC; IMF; RBA; United Nations Graph 1.10 Electronic Goods Demand Growth Year-ended % % World – semiconductor sales (RHS) 15 40 0 0 US – retail sales (LHS, electronics & appliances) -15 -40 US – investment (LHS, information processing equipment & software) -30 1999 2002 2005 Sources: RBA; Thomson Reuters 8 R ES ERV E B A N K O F AUS T RA L I A 2008 2011 -80 In east Asia (excluding China and Japan), industrial production has grown only modestly over 2011 (Graph 1.9). This partly reflects an easing in the pace of electronics production in the region, consistent with slowing investment in computing equipment and demand for consumer electronics in the euro area and the United States (Graph 1.10). After strong growth in July following the easing of supply-chain disruptions from the Japanese earthquake, exports fell modestly in August and values data suggest a further decline in September. Weakness in exports to the North Atlantic economies, primarily reflecting the subdued demand for electronics, has been partly offset by a noticeable pick-up in exports to other countries outside the region. Domestic demand in the region grew strongly in the middle of the year, but timely data suggest that momentum has eased in recent months. Retail sales and indicators of investment in the higher-income economies have softened a little, reflecting the tightening of monetary policy in 2010 and early 2011 and the effects of weaker external demand. Nonetheless, retail sales grew at an above-average pace in the September quarter and consumer confidence has remained high in most countries in the region, despite concerns about global growth and significant falls in local share markets. Headline rates of inflation in east Asia are lower than their rapid pace earlier in the year, as energy prices have fallen and food price inflation has eased. Monthly rates of core inflation have been above average for most of 2011, and measures of capacity utilisation, including employment rates, remain at high levels. Following a relatively rapid rebound through the June quarter, the pace of recovery of the Japanese economy from earthquake-related disruptions has slowed. Consumption expenditure has only just reached its pre-earthquake levels, and industrial production fell in September after growing only modestly over July and August to be well below pre-earthquake levels (Graph 1.11). There has been an increase in imports of liquefied natural gas (LNG) to power thermal generators, since the majority of nuclear power stations across Japan are currently shut down. Looking through some policy-related volatility, housing starts in the earthquake-affected regions have increased and the rebuilding is expected to boost growth over the coming year. Graph 1.11 Japan – Economic Indicators Index 2006 average = 100 Industrial production Real household expenditure Index 100 100 80 96 and France together account for over 20 per cent of merchandise exports from Greece, Ireland, Italy, Portugal and Spain. In Greece and Portugal, GDP has continued to contract, while growth remains weak in Italy and Spain (Graph 1.12). Activity is expected to remain weak in these economies for an extended period, as a result of ongoing fiscal consolidation to lower debt burdens and the substantial structural adjustments that are still needed to regain competitiveness (Graph 1.13). Outcomes in Ireland have been somewhat better; after a very large contraction in output, the Irish economy returned to growth in 2011, partly as a result of a marked improvement in competitiveness. Graph 1.12 Euro Area – GDP March quarter 2008 = 100 Index 60 2007 2009 2011 2007 2009 2011 92 Index Germany 100 Portugal Source: Thomson Reuters United States and Europe The pace of growth in the euro area has slowed and the outlook for Europe remains highly uncertain. The German economy has been benefiting from relatively low growth in unit labour costs over a number of years, which, combined with the depreciation of the exchange rate, a global recovery in investment and growing demand for consumer durables in China, has driven strong export-led growth. Recently, however, sharp declines in confidence, fiscal tightening and continued weak consumer demand have slowed the recovery in domestic demand. Retail sales in Germany fell by 2 per cent over the three months to September and forward-looking indicators of growth in exports and in machinery and equipment investment have moderated. Elsewhere in the euro area, particularly in Greece, Ireland, Italy, Portugal and Spain, fiscal tightening, banking system issues, reduced confidence and high unemployment are weighing on domestic demand. Furthermore, the slowing in the northern euro area economies is likely to make economic conditions in the southern economies more difficult; Germany 100 France Spain 95 95 Italy Greece* 90 90 Ireland 85 2009 2011 2009 2011 85 * Seasonally adjusted by RBA from March 2010 Sources: RBA; Thomson Reuters Graph 1.13 Euro Area – Gross Government Debt Per cent of GDP % % IMF forecast 150 150 Greece* Italy 100 100 Portugal Germany Spain 50 50 France Ireland 0 1991 1996 2001 2006 2011 0 2016 * Forecast does not incorporate policy and macroeconomic developments since September 2011 Source: IMF STATE ME N T O N MO N E TARY P O L ICY | N O V E M B E R 2 0 1 1 9 Growth in the United States was subdued in the first half of 2011, reflecting the ongoing difficult adjustment in balance sheets following the financial crisis, as well as temporary factors including the supply-chain disruptions from the Japanese earthquake and high oil prices. Data for recent months have, on balance, been a little more positive. GDP grew by 0.6 per cent in the September quarter, driven by growth in consumption and business investment, and forward-looking indicators of activity continue to improve. Despite the recent pick-up in growth, GDP has only just returned to its pre-crisis peak and the labour market is still soft (Graph 1.14). In early September President Obama proposed a fiscal stimulus package worth around 3 per cent of GDP, although it is uncertain which parts of the package might be passed by Congress. The Federal Reserve has also begun to increase the average maturity of its portfolio to put further downward pressure on long-term interest rates (see ‘International and Foreign Exchange Markets’ chapter for more details). Graph 1.14 United States – GDP and Employment Index % December 2007 = 100 Unemployment rate 100 10 Real GDP (quarterly) 98 8 96 6 has been accompanied by a fall in the saving ratio, as the weak labour market has weighed on income growth. The unemployment rate remains high at 9.1 per cent, and recent data on employment growth and initial jobless claims suggest that the recovery in the labour market is proceeding very slowly. The private sector continues to hire people at only a modest pace, while public-sector employment is still declining, reflecting ongoing budgetary pressures at all levels of government. The housing market also remains weak. The stock of unsold homes has not declined significantly and housing construction activity continues to be at very low levels. Population growth is, however, gradually reducing the underlying surplus of houses and there are some signs that house prices have stabilised, particularly in those areas that were less affected by overbuilding in the mid 2000s. Despite falls in survey-based measures of business conditions, data on business activity have been more positive. Machinery & equipment investment grew by 4.1 per cent in the September quarter and forward-looking indicators of investment suggest continued expansion (Graph 1.15). Industrial production continues to recover from the soft patch in the middle of the year related to the Japanese supply-chain disruptions, while non-residential building activity has also picked up in recent months, although from low levels. Graph 1.15 United States – Production and Orders 2007 average = 100 94 4 Index Non-farm payrolls 92 2007 2009 2011 2007 2009 2011 Industrial production Core capital goods orders* 2 Source: Thomson Reuters In contrast to the declines in consumption that followed the sharp falls in confidence and financial wealth in 2008, consumption growth picked up in the September quarter. Growth was driven by consumption of services, while consumption of motor vehicles contracted for the second consecutive quarter. The growth in consumption 100 100 85 85 70 2007 2009 2011 2007 2009 * New non-defence capital goods orders excluding aircraft Source: Thomson Reuters 10 R ES ERV E B A N K O F AUS T RA L I A Index 2011 70 Headline inflation in the United States remains quite high, despite subdued activity. Core CPI inflation has picked up to 2.0 per cent in year-ended terms, although the monthly pace eased in September, while year-ended food price inflation reached 4¾ per cent. Although oil prices have moderated since April, retail energy prices have remained relatively high. Commodity Prices Global commodity prices have mostly fallen over the past three months as concerns about global growth have escalated amid ongoing sovereign debt problems in Europe. Spot prices for iron ore and coking coal have declined sharply, pointing to some easing in global demand in addition to increasing supply (Graph 1.16 and Table 1.1). Some exchangetraded commodities, in particular base metals, have Graph 1.16 Chinese Steel Prices US$/t US$/t Steel rebar 700 700 500 500 Hot rolled steel sheet 300 l 2007 l 2008 2009 l 2010 l 2011 300 Sources: Bloomberg; RBA Table 1.1: Commodity Price Growth(a) SDR, per cent Change since previous Statement Change over the past year – Iron ore –34 –20 Bulk commodities(b) – Coking coal –21 6 – Thermal coal –1 12 Rural –3 3 – Beef 4 10 – Cotton –3 –28 – Wheat –4 3 – Wool –10 30 Base metals –14 –11 – Aluminium –12 –12 – Copper –14 –5 – Lead –17 –17 – Nickel –20 –21 – Zinc –15 –19 Gold 8 29 Oil 6 23 – US$ terms 3 23 –4 19 (c) RBA ICP (a) RBA Index of Commodity Prices components except oil and bulk commodities; latest available (b) Spot prices (c) Average of WTI and Tapis crude oil prices Sources: Bloomberg; RBA STATE ME N T O N MO N E TARY P O L ICY | N O V E M B E R 2 0 1 1 11 also recorded pronounced falls, in line with weaker sentiment in financial markets. Spot prices for the steelmaking commodities – iron ore and coking coal – have fallen sharply over the past month or so, as have steel prices, reflecting a decline in the demand for steel. Weak demand has also led to a slowing in global steel production. Demand for iron ore in Europe appears to have weakened, which has led to some diversion of supply towards Asia, although reports suggest that demand from Asia has also eased. Increased global supply, owing to iron ore capacity expansions and the recovery in Australian coal production following the Queensland floods, may have also weighed on prices. The iron ore spot price has declined particularly rapidly, to around 30 per cent below the December quarter contract price, though it remains more than double the lows seen in 2009 (Graph 1.17). The coking coal spot price is around 16 per cent below the current contract price, but it remains above the levels seen prior to the sharp increase following the Queensland floods. Pricing mechanisms in the iron ore market continue to evolve. Terms for contract sales continue to shorten, with a significant proportion of sales now on a monthly basis, which is spurring the development of iron ore swaps and futures markets. Bulk Commodity Prices Free on board basis Iron ore US$/t Hard coking coal Spot 160 Base metals prices, as measured by the RBA Index of Commodity Prices, have fallen by 14 per cent since the previous Statement, reflecting the reassessment of prospective global demand and production (Graph 1.18). The prices of precious metals have fluctuated significantly over recent months. The gold price posted a fresh record high in early September, before declining sharply; nonetheless, it remains at a high level. Graph 1.18 Base Metals Prices and Industrial Production Year-ended percentage change % % Base metals* (LHS) 80 Graph 1.17 US$/t The prices of energy-related commodities such as thermal coal and oil have been little changed over recent months. The resilience of the thermal coal spot price, relative to the other bulk commodities, may reflect different demand conditions; the shutdown of nuclear power generation capacity in several countries and relatively weak hydroelectricity production in China appear to be providing particular impetus to thermal coal demand. Global crude oil prices have been broadly steady over recent months, as the supply-demand balance remains relatively tight, owing partly to disrupted supplies from Libya. 400 10 40 5 0 0 -40 -5 World industrial production (RHS) 120 300 -80 80 200 -120 -10 1999 2003 2007 2011 * SDR terms Sources: CEIC; RBA; Thomson Reuters; United Nations 40 0 100 Contract l 2007 l l 2009 l l 2011 l l 2009 Sources: ABARES; Bloomberg; Citigroup; Energy Publishing; Macquarie Bank; RBA 12 R ES ERV E B A N K O F AUS T RA L I A l 2011 0 Global food prices have continued to fall over recent months, contributing to some moderation in global consumer price inflation. The price declines have been broadly based. Nonetheless, prices remain high, as strong income and population growth in developing countries, combined with their relatively -15 high income elasticity of food demand, continue to support demand for grains and increasingly for high-protein foodstuffs such as meat. Poor climatic conditions have weighed on the outlook for supply of a number of rural commodities over recent months, including wheat, corn and cotton, but the impact on prices has been muted given the broader easing in commodity markets (Graph 1.19). Wool prices have also fallen over the past three months, which has been attributed to a softening in demand from Chinese wool mills, but they remain at high levels after an earlier strong run-up. In aggregate, the RBA Index of Commodity Prices has fallen by 4 per cent over the past three months, although recent falls in spot prices for the bulk commodities are yet to be fully reflected in this index; other aggregate measures of commodity prices have also generally recorded falls over recent months (for more detail on alternative measures of commodity prices, see ‘Box A: A Comparison of Commodity Indices’). Graph 1.19 Commodity Prices Weekly Index 220 US$/b Base metals* Tapis oil 150 Rural* 190 125 160 100 130 75 100 50 70 l 2005 l l l 2008 l l 2011 l l l l 2008 l l 2011 25 * RBA Index of Commodity Prices sub-indices; SDR terms; 2005 average = 100 Sources: Bloomberg; RBA STATE ME N T O N MO N E TARY P O L ICY | N O V E M B E R 2 0 1 1 13
